UNITED STATES
SECURITIES AND EXCHANGE COMMISSION
Washington, D.C. 20549
FORM
|
|
ANNUAL REPORT PURSUANT TO SECTION 13 OR 15(d) OF THE SECURITIES EXCHANGE ACT OF 1934 |
For the fiscal year ended
OR
|
|
TRANSITION REPORT PURSUANT TO SECTION 13 OR 15(d) OF THE SECURITIES EXCHANGE ACT OF 1934 |
For the transition period from _____ to _____
Commission File Number:

(Exact name of registrant as specified in its charter)
|
|
|
|
|
(State or other jurisdiction of incorporation or organization) |
|
(I.R.S. Employer Identification No.) |
|
|
|
|
|
|
|
|
|
(Address of principal executive offices) |
|
(Zip Code) |
(
(Registrant’s telephone number, including area code)
Securities registered pursuant to section 12(b) of the Act:
|
Title of each class |
|
Trading Symbol(s) |
|
Name of each exchange on which registered |
|
None |
|
None |
|
None |
Securities registered pursuant to section 12(g) of the Act: None
Indicate by check mark if the registrant is a well-known seasoned issuer, as defined in Rule 405 of the Securities Act.
Indicate by check mark if the registrant is not required to file reports pursuant to Section 13 or Section 15(d) of the Act. Yes ☐
Indicate by check mark whether the registrant (1) has filed all reports required to be filed by Section 13 or 15(d) of the Securities Exchange Act of 1934 during the preceding 12 months (or for such shorter period that the registrant was required to file such reports), and (2) has been subject to such filing requirements for the past 90 days.
Indicate by check mark whether the registrant has submitted electronically every Interactive Data File required to be submitted pursuant to Rule 405 of Regulation S-T (§232.405 of this chapter) during the preceding 12 months (or for such shorter period that the registrant was required to submit such files).
Indicate by check mark whether the registrant is a large accelerated filer, an accelerated filer, a non-accelerated filer, smaller reporting company, or an emerging growth company. See the definitions of “large accelerated filer,” “accelerated filer,” “smaller reporting company” and “emerging growth company” in Rule 12b-2 of the Exchange Act.
|
|
|
|
|
|
|
Large accelerated filer |
☐ |
|
Accelerated filer |
☐ |
|
|
☑ |
|
Smaller reporting company |
|
|
|
|
|
Emerging growth company |
|
If an emerging growth company, indicate by check mark if the registrant has elected not to use the extended transition period for complying with any new or revised financial accounting standards provided pursuant to Section 13(a) of the Exchange Act. ☐
Indicate by check mark whether the registrant has filed a report on and attestation to its management’s assessment of the effectiveness of its internal control over financial reporting under Section 404(b) of the Sarbanes-Oxley Act (15 U.S.C. 7262(b)) by the registered public accounting firm that prepared or issued its audit report.
Indicate by check mark whether the registrant is a shell company (as defined in Rule 12b-2 of the Exchange Act). Yes
As of February 12, 2021, there were
DOCUMENTS INCORPORATED BY REFERENCE
None
TABLE OF CONTENTS
|
PART I |
||
|
|
|
|
|
|
4 |
|
|
|
|
|
|
|
29 |
|
|
|
|
|
|
|
51 |
|
|
|
|
|
|
|
51 |
|
|
|
|
|
|
|
51 |
|
|
|
|
|
|
|
52 |
|
|
|
|
|
|
PART II |
||
|
|
|
|
|
|
53 |
|
|
|
|
|
|
|
54 |
|
|
|
|
|
|
Item 7. Management’s Discussion and Analysis of Financial Condition and Results of Operations |
|
55 |
|
|
|
|
|
Item 7A. Quantitative and Qualitative Disclosures About Market Risk. |
|
72 |
|
|
|
|
|
|
75 |
|
|
|
|
|
|
Item 9. Changes in and Disagreements With Accountants on Accounting and Financial Disclosure. |
|
75 |
|
|
|
|
|
|
75 |
|
|
|
|
|
|
|
75 |
|
|
|
|
|
|
PART III |
||
|
|
|
|
|
Item 10. Directors, Executive Officers and Corporate Governance. |
|
76 |
|
|
|
|
|
|
82 |
|
|
|
|
|
|
|
82 |
|
|
|
|
|
|
Item 13. Certain Relationships and Related Transactions, and Director Independence. |
|
84 |
|
|
|
|
|
|
88 |
|
|
|
|
|
|
PART IV |
||
|
|
|
|
|
|
89 |
|
|
|
|
97 |
|
|
||
|
SIGNATURES |
||
|
|
|
|
|
|
98 |
|
1
CAUTIONARY STATEMENT ABOUT FORWARD-LOOKING STATEMENTS
Targa Resources Partners LP’s (together with its subsidiaries, “we,” “us,” “our,” “TRP” or the “Partnership”) reports, filings and other public announcements may from time to time contain statements that do not directly or exclusively relate to historical facts. Such statements are “forward-looking statements.” You can typically identify forward-looking statements within the meaning of Section 27A of the Securities Act of 1933, as amended, and Section 21E of the Securities Exchange Act of 1934, as amended, by the use of forward-looking statements, such as “may,” “could,” “project,” “believe,” “anticipate,” “expect,” “estimate,” “potential,” “plan,” “forecast” and other similar words.
All statements that are not statements of historical facts, including statements regarding our future financial position, business strategy, budgets, projected costs and plans and objectives of management for future operations, are forward-looking statements.
These forward-looking statements reflect our intentions, plans, expectations, assumptions and beliefs about future events and are subject to risks, uncertainties and other factors, many of which are outside our control. Important factors that could cause actual results to differ materially from the expectations expressed or implied in the forward-looking statements include known and unknown risks. Known risks and uncertainties include, but are not limited to, the following risks and uncertainties:
|
|
• |
the level and success of crude oil and natural gas drilling around our assets, our success in connecting natural gas supplies to our gathering and processing systems, oil supplies to our gathering systems and natural gas liquid supplies to our logistics and transportation facilities and our success in connecting our facilities to transportation services and markets; |
|
|
• |
the timing and extent of changes in natural gas, natural gas liquids, crude oil and other commodity prices, interest rates and demand for our services; |
|
|
• |
our ability to access the capital markets, which will depend on general market conditions and the credit ratings for our debt obligations and demand for our senior notes; |
|
|
• |
the impact of outbreaks of illnesses, pandemics (like COVID-19) or any other public health crises; |
|
|
• |
the amount of collateral required to be posted from time to time in our transactions; |
|
|
• |
our success in risk management activities, including the use of derivative instruments to hedge commodity price risks; |
|
|
• |
the level of creditworthiness of counterparties to various transactions with us; |
|
|
• |
changes in laws and regulations, particularly with regard to taxes, safety and protection of the environment; |
|
|
• |
weather and other natural phenomena; |
|
|
• |
industry changes, including the impact of consolidations and changes in competition; |
|
|
• |
our ability to timely obtain and maintain necessary licenses, permits and other approvals; |
|
|
• |
our ability to grow through internal growth capital projects or acquisitions and the successful integration and future performance of such assets; |
|
|
• |
general economic, market and business conditions; and |
|
|
• |
the risks described elsewhere in “Item 1A. Risk Factors” in this Annual Report and our reports and registration statements filed from time to time with the United States Securities and Exchange Commission (“SEC”). |
Additionally, while we have not been previously materially impacted by prior outbreaks of illnesses, pandemics or other public health crises, there are potential risks to us from the continued impact on global demand for energy commodities related to the COVID-19 pandemic. The COVID-19 pandemic reduced economic activity and the related demand for energy commodities, which contributed to weakened commodity prices compared to historical levels and price volatility during the year ended December 31, 2020 and is expected to continue to impact demand over the short-to-medium term.
2
Although we believe that the assumptions underlying our forward-looking statements are reasonable, any of the assumptions could be inaccurate, and, therefore, we cannot assure you that the forward-looking statements included in this Annual Report will prove to be accurate. Some of these and other risks and uncertainties that could cause actual results to differ materially from such forward-looking statements are more fully described in “Item 1A. Risk Factors” in this Annual Report. Except as may be required by applicable law, we undertake no obligation to publicly update or advise of any change in any forward-looking statement, whether as a result of new information, future events or otherwise.
As generally used in the energy industry and in this Annual Report, the identified terms have the following meanings:
|
Bbl |
Barrels (equal to 42 U.S. gallons) |
|
BBtu |
Billion British thermal units |
|
Bcf |
Billion cubic feet |
|
Btu |
British thermal units, a measure of heating value |
|
/d |
Per day |
|
GAAP |
Accounting principles generally accepted in the United States of America |
|
gal |
U.S. gallons |
|
LIBOR |
London Interbank Offered Rate |
|
LPG |
Liquefied petroleum gas |
|
MBbl |
Thousand barrels |
|
MMBbl |
Million barrels |
|
MMBtu |
Million British thermal units |
|
MMcf |
Million cubic feet |
|
MMgal |
Million U.S. gallons |
|
NGL(s) |
Natural gas liquid(s) |
|
NYMEX |
New York Mercantile Exchange |
|
NYSE |
New York Stock Exchange |
|
SCOOP |
South Central Oklahoma Oil Province |
|
STACK |
Sooner Trend, Anadarko, Canadian and Kingfisher |
|
VLGC |
Very large gas carrier |
3
PART I
Item 1. Business.
The following section of this Form 10-K generally refers to business developments during the year ended December 31, 2020. Discussion of prior period business developments that are not included in this Form 10-K can be found in “Part I, Item 1. Business” of our Annual Report on Form 10-K for the year ended December 31, 2019.
Overview
Targa Resources Partners LP is a Delaware limited partnership formed in October 2006 by our parent, Targa Resources Corp. (“Targa” or “TRC” or the “Company” or “Parent”), to own, operate, acquire and develop a diversified portfolio of complementary domestic midstream infrastructure assets. Our 9.00% Series A Fixed-to-Floating Rate Cumulative Redeemable Perpetual Preferred Units (the “Preferred Units”) that were issued in October 2015 were redeemed in December 2020 and are no longer outstanding as of the end of the year. Prior to the redemption, the Preferred Units were limited partner interests in us and were traded on the NYSE under the symbol “NGLS/PA.”
As used herein, "units" refers to our units representing limited partner interests in the Partnership and not to the Preferred Units (as defined herein) and "unitholders" refers to the holders of units. Unless the context requires otherwise, the term "limited partner interests" refers to the units and the Preferred Units, collectively, and “limited partners” refers to the holders of limited partner interests.
The following should be read in conjunction with our audited consolidated financial statements and the notes thereto. We have prepared our accompanying consolidated financial statements under GAAP and the rules and regulations of the SEC. Our accounting records are maintained in U.S. dollars and all references to dollars in this report are to U.S. dollars, except where stated otherwise. Our consolidated financial statements include our accounts and those of our majority-owned and/or controlled subsidiaries, and all significant intercompany items have been eliminated in consolidation. The address of our principal executive offices is 811 Louisiana Street, Suite 2100, Houston, Texas 77002, and our telephone number at this address is (713) 584-1000.
Our Operations
We are engaged primarily in the business of:
|
|
• |
gathering, compressing, treating, processing, transporting and purchasing and selling natural gas; |
|
|
• |
transporting, storing, fractionating, treating and purchasing and selling NGLs and NGL products, including services to LPG exporters; and |
|
|
• |
gathering, storing, terminaling and purchasing and selling crude oil. |
To provide these services, we operate in two primary segments: (i) Gathering and Processing, and (ii) Logistics and Transportation (also referred to as the Downstream Business).
Our Gathering and Processing segment includes assets used in the gathering and/or purchase and sale of natural gas produced from oil and gas wells, removing impurities and processing this raw natural gas into merchantable natural gas by extracting NGLs; and assets used for the gathering and terminaling and/or purchase and sale of crude oil. The Gathering and Processing segment's assets are located in the Permian Basin of West Texas and Southeast New Mexico (including the Midland, Central and Delaware Basins); the Eagle Ford Shale in South Texas; the Barnett Shale in North Texas; the Anadarko, Ardmore, and Arkoma Basins in Oklahoma (including the SCOOP and STACK) and South Central Kansas; the Williston Basin in North Dakota (including the Bakken and Three Forks plays); and the onshore and near offshore regions of the Louisiana Gulf Coast and the Gulf of Mexico.
Our Logistics and Transportation segment includes the activities and assets necessary to convert mixed NGLs into NGL products and also includes other assets and value-added services such as transporting, storing, fractionating, terminaling, and marketing of NGLs and NGL products, including services to LPG exporters and certain natural gas supply and marketing activities in support of our other businesses. The Logistics and Transportation segment also includes the Grand Prix NGL Pipeline (“Grand Prix”), which connects our gathering and processing positions in the Permian Basin, Southern Oklahoma and North Texas with our downstream facilities in Mont Belvieu, Texas, as well as our equity interest in Gulf Coast Express Pipeline LLC (“GCX”), a natural gas pipeline connecting the Waha hub in West Texas and other receipt points, including many of our Midland Basin processing facilities, to Agua Dulce in South Texas and other delivery points. The associated assets, including these pipelines, are generally connected to and supplied in part by our Gathering and Processing segment and, except for the pipelines and smaller terminals, are located predominantly in Mont Belvieu and Galena Park, Texas, and in Lake Charles, Louisiana.
4
Other contains the unrealized mark-to-market gains/losses related to derivative contracts that were not designated as cash flow hedges.
The map below highlights our more significant assets:

Recent Developments
Response to Current Market Conditions
During 2020, global commodity prices declined due to factors that significantly impacted both supply and demand. As the COVID-19 pandemic spread and travel and other restrictions were implemented globally, the demand for commodities declined substantially. Additionally, certain major oil producing nations significantly increased their oil and gas production late in the first quarter which further contributed to the surplus production of commodities. Despite these nations subsequently agreeing to reduce global commodity supplies and global economies beginning to re-open, commodity prices remained weak relative to historical levels and continued to be volatile. Reduced economic activity due to the COVID-19 pandemic, combined with uncertainty around global commodity supply and demand, contributed to lower commodity prices.
Furthermore, the decline in commodity prices led many exploration and production companies to reduce planned capital expenditures for drilling and production activities and also led to some companies shutting in wells primarily in the first half of 2020. Such price and activity declines negatively impacted our operations by (i) reducing investments by third parties in the development of new oil and gas reserves, therefore reducing volumes coming onto our systems in the future, (ii) decreasing volumes processed in our facilities and transported on our pipelines and (iii) reducing the prices we receive from the sale of commodities. While commodity prices remain low relative to historical levels and uncertainties associated with the impacts of COVID-19 continue, production from wells that were previously shut-in during the first half of 2020 across our operating areas has largely resumed and energy demand and commodity prices continued to recover compared to the first half of 2020.
5
There has been, and likely will continue to be, volatility in commodity prices and in the relationships among NGL, crude oil and natural gas prices. We are uncertain of what pricing and market demand, and the associated impact to demand for our services, will be throughout 2021. Across our operations, particularly in our Downstream Business, we benefit from long-term fee-based arrangements for our services. The significant level of margin we derive from fee-based arrangements, combined with our hedging arrangements, helps to mitigate our exposure to commodity price movements. For additional information regarding our hedging activities, see “Item 7A. Quantitative and Qualitative Disclosures about Market Risk—Commodity Price Risk.”
In response to market conditions, we continue to work through numerous internal initiatives to respond to current market conditions, including identifying and implementing cost reduction measures such as reducing or deferring non-essential operating and general and administrative expenses.
We believe that our long-term strategy, combined with our high-quality asset portfolio, allows us to generate attractive cash flows across commodity price environments. Geographic, business and customer diversity enhances our ability to generate sufficient cash flows to fund our requirements. Our assets are positioned in strategic oil and gas producing areas across multiple basins and provide services under attractive contract terms to a diverse mix of customers across our operational areas. Our contract portfolio has attractive rates and term characteristics, including a significant fee-based component, especially in our Downstream Business. Our Gathering and Processing segment contract mix also has components of fee-based margin, such as fee floors and other fee-based services which mitigate against low commodity prices.
We are currently experiencing no material issues with potential workforce disruptions, and we remain focused on safeguarding employee health and safety and ensuring safe and reliable operations in response to COVID-19. Additionally, we are currently experiencing no material supply chain disruptions as a result of the COVID-19 pandemic, and our relationships with our major customers continue to be strong. However, if any of these circumstances change, our business could be adversely affected. Additionally, although significant progress has been made towards the development, distribution and administration of various COVID-19 vaccines, their potential safety and efficacy and timing around when they will become widely available is uncertain at this point. Further, as there is significant uncertainty around the breadth and duration of the disruptions to global energy markets related to the aforementioned current events, we are unable to determine the extent that these events could materially impact our future financial position, operations and/or cash flows.
Gathering and Processing Segment Expansions
Permian Midland Processing Expansion
In November 2020, we announced the transfer of an existing cryogenic natural gas processing plant from our North Texas system (the “Longhorn Plant”), to our Permian Midland system. The plant will be relocated to, and installed in Reagan County, Texas, in 2021 as a new 200 MMcf/d cryogenic natural gas processing plant (the “Heim Plant”). The Heim Plant will process natural gas production from the Permian Basin and is expected to begin operations in the fourth quarter of 2021.
In August 2019, we announced that we began construction of a new 250 MMcf/d cryogenic natural gas processing plant in the Midland Basin (the “Gateway Plant”), which commenced operations in the third quarter of 2020.
Permian Delaware Processing Expansions
In March 2018, we announced that we entered into long-term fee-based agreements with an investment grade energy company for natural gas gathering and processing services in the Delaware Basin and for downstream transportation, fractionation and other related services. The agreements are underpinned by the customer’s dedication of significant acreage within a large, well-defined area in the Delaware Basin. In addition to high-pressure rich gas gathering pipelines and a natural gas processing plant (the “Falcon Plant”), which were placed into service in 2019, we commenced operations of a second 250 MMcf/d cryogenic natural gas processing plant (the “Peregrine Plant”), in the second quarter of 2020.
We provide NGL transportation services on Grand Prix and fractionation services at our Mont Belvieu complex for a majority of the NGLs from the Falcon and Peregrine plants.
6
Logistics and Transportation Segment Expansion
Grand Prix NGL Pipeline Extension
In February 2019, we announced an extension of Grand Prix (the “Central Oklahoma Extension”), extending from Southern Oklahoma to the STACK region of Central Oklahoma where it connects with The Williams Companies, Inc. (“Williams”) Bluestem Pipeline, linking the Conway, Kansas, and Mont Belvieu, Texas, NGL markets. In connection with this project, Williams has committed significant volumes to us that we will transport on Grand Prix and fractionate at our Mont Belvieu facilities. The Central Oklahoma Extension began operations late in the fourth quarter of 2020. Transportation volumes on the Central Oklahoma Extension accrue solely to Targa’s benefit and are not included in Grand Prix Pipeline LLC (“Grand Prix Joint Venture”), a consolidated subsidiary of which Targa owns a 56% interest.
Fractionation Expansions
In November 2018, we announced plans to construct two new 110 MBbl/d fractionation trains in Mont Belvieu, Texas (“Train 7” and “Train 8”). Train 7 commenced operations in the first quarter of 2020 and Train 8 commenced operations in the third quarter of 2020. In January 2019, Williams committed significant volumes which Targa will transport on Grand Prix and fractionate at Targa’s Mont Belvieu facilities (including Train 7). Williams was also granted an option to purchase a 20% equity interest in the fractionation train, which was originally wholly owned by Targa. Williams exercised its initial option and executed a joint venture agreement with us with respect to Train 7 in the second quarter of 2019. Certain fractionation-related infrastructure for Train 7, such as storage caverns and brine handling, was funded and is owned 100% by Targa. Train 8 is owned 100% by Targa.
LPG Export Expansion
In February 2019, we announced plans to further expand our LPG export capabilities of propane and butanes at our Galena Park Marine Terminal by increasing refrigeration capacity and associated load rates. The expansion was complete and began operation in the third quarter of 2020. With the additional infrastructure, we increased our effective export capacity up to 15 MMBbl per month in the third quarter of 2020, but given the mix of propane and butane demand, vessel size and availability of supply, and a variety of other factors, our effective working capacity is estimated to be approximately 12.5 MMBbl per month.
Asset Sales
In the fourth quarter of 2020, we closed on the sale of assets in Channelview, Texas for approximately $58 million.
In the first quarter of 2020, we closed on the sale of the Delaware crude system, which was effective December 1, 2019, for approximately $134 million.
Financing Activities
In February 2021, we issued $1.0 billion of 4% Senior Notes due 2032, resulting in net proceeds of approximately $992 million. A portion of the net proceeds from the issuance were used to fund the concurrent cash tender offer and subsequent redemption payment for our 5⅛% Senior Notes due 2025 (the “5⅛% Notes”), with the remainder used for repayment of borrowings under our senior secured revolving credit facility (the “TRP Revolver”) and Targa’s senior secured revolving credit facility (the “TRC Revolver”).
Additionally, Targa Pipeline Partners LP (“TPL”) issued notices of redemption for all of the outstanding TPL 4¾% Senior Notes due 2021 and TPL 5⅞% Senior Notes due 2023. These notes will be redeemed on February 22, 2021 with available liquidity under the TRP Revolver.
In December 2020, we redeemed all of our 5,000,000 issued and outstanding Preferred Units at a redemption price of $25.00 per unit, plus an amount equal to all unpaid distributions up to the date of redemption. The difference between the consideration paid (including unpaid distributions of $0.5 million) and the net carrying value of the units redeemed was $4.9 million, which was recorded as an increase to net income attributable to the preferred limited partners for the year ended December 31, 2020. The redemption of the Preferred Units is consistent with our ongoing efforts to simplify our capital structure and to identify opportunities to generate additional cash flow by enabling us to realize significant annual cash savings associated with the elimination of Preferred Unit distributions.
7
In August 2020, we issued $1.0 billion of 4⅞% Senior Notes due 2031, resulting in net proceeds of approximately $991 million. A portion of the net proceeds from the issuance were used to fund the concurrent cash tender offer (the “August Tender Offer”) and redemption payments for our 6¾% Senior Notes due 2024 (the “6¾% Notes”), with the remainder used for repayment of borrowings under the TRP Revolver.
We accepted for purchase all the 6¾% Notes that were validly tendered as of the early tender date, which totaled $262.1 million and redeemed the remaining aggregate principal amount of the 6¾% Notes, which totaled $318.0 million. We recorded a loss due to debt extinguishment of $13.7 million comprised of $11.1 million premiums paid and a write-off of $2.6 million of debt issuance costs. In November 2020, we redeemed the $559.6 million remaining balance of our 5¼% Senior Notes due 2023 with available liquidity under the TRP Revolver. We recorded a loss due to debt extinguishment of $1.8 million comprised of a write-off of debt issuance costs.
Additionally, during the first half of 2020, we repurchased a portion of our outstanding senior notes on the open market, paying $239.8 million plus accrued interest to repurchase $303.3 million of the notes. The repurchases resulted in a $61.1 million net gain, which included the write-off of $2.4 million in related debt issuance costs.
We may retire or purchase various series of our outstanding debt through cash purchases and/or exchanges for other debt, in open market purchases, privately negotiated transactions or otherwise. Such repurchases or exchanges, if any, will depend on prevailing market conditions, our liquidity requirements, contractual restrictions and other factors. The amounts involved may be material.
In the second quarter of 2020, we amended our accounts receivable securitization facility (the “Securitization Facility”) to decrease the facility size from $400.0 million to $250.0 million and extended the facility termination date to April 21, 2021. Subsequently, in the fourth quarter of 2020, we amended our Securitization Facility to increase the facility size to $350 million to more closely align with the borrowing base availability under the Securitization Facility.
Organization Structure
On October 19, 2016, we executed the Third Amended and Restated Agreement of Limited Partnership, effective as of December 1, 2016. As a result of the TRC/TRP Merger, Targa owns all of the outstanding TRP common units. Targa also maintains a 2% general partner interest in us. The Partnership Agreement with us governs our relationship regarding certain reimbursement and indemnification matters. See “Item 13. Certain Relationships and Related Transactions and Director Independence.”
Targa has used us as a growth vehicle to pursue the acquisition and expansion of midstream natural gas, NGL, crude oil and other complementary energy businesses and assets as evidenced by our acquisitions of businesses from Targa. However, Targa is not prohibited from competing with us and may evaluate acquisitions and dispositions that do not involve us. In addition, through our relationship with Targa, we have access to a significant pool of management talent, strong commercial relationships throughout the energy industry and access to Targa’s broad operational, commercial, technical, risk management and administrative infrastructure.
We do not have any employees to carry out our operations. Targa charges us for all the direct costs of the employees assigned to our operations, as well as all general and administrative support costs other than its direct support costs of being a separate reporting company and its cost of providing management and support services to certain unaffiliated spun-off entities. We generally reimburse Targa for cost allocations to the extent that they have required a current cash outlay by Targa. See “—Human Capital” for further information.
8
The diagram below shows our corporate structure as of February 12, 2021:

_______________
|
(1) |
Common shares outstanding as of February 12, 2021. |
Growth Drivers
We believe that our near-term growth will be driven by organic projects being placed into service, as well as the level of producer activity in the basins where our gathering and processing infrastructure is located and the level of demand for services provided by our logistics and transportation assets. We believe our assets are not easily replicated, are located in many attractive and active areas of exploration and production activity and are near key markets and logistics centers. Grand Prix connects our gathering and processing positions in the Permian Basin, Southern Oklahoma and North Texas with our downstream facilities in Mont Belvieu, Texas and further increases our competitive capabilities to provide reliable, integrated midstream services to customers. Over the longer term, we expect our growth will continue to be driven by our integrated midstream service offering and the strong position of our quality assets which will benefit from production from shale plays and by the deployment of shale exploration and production technologies in both liquids-rich natural gas and crude oil resource plays that will also provide additional opportunities for our Downstream Business. We expect that organic growth and third-party acquisitions will continue to be a part of our long-term growth strategy.
Attractive Asset Positions
We believe that our position in some of the most attractive basins will allow us to capture increased natural gas supplies for gathering, processing and/or purchase and sale, increased NGLs for transportation and fractionation and increased crude oil supplies for gathering, terminaling and/or purchase and sale. Producers continue to focus drilling activity on their most attractive acreage, especially in the Permian Basin where we have a large and well-positioned interconnected footprint and are benefiting from rig activity in and around our systems.
The continued development of shale and unconventional resource plays has resulted in increasing NGL supplies that continue to generate demand for our transportation services on Grand Prix, fractionation services at the Mont Belvieu market hub and for LPG export services at our Galena Park Marine Terminal on the Houston Ship Channel. In response to increasing demand, we added 320 MBbl/d of additional fractionation capacity with the recent completions of Trains 6, 7 and 8, which began operations in the second quarter of 2019, first quarter of 2020 and third quarter of 2020. We believe that the higher volumes of fractionated NGLs will also result in increased demand for other related fee-based services provided by our logistics and transportation assets. Additionally, we added LPG export infrastructure in the third quarter of 2020, which increased our effective export capacity up to 15 MMBbl per month, but given the mix of propane and butane demand, vessel size and availability of supply, and a variety of other factors, our effective working capacity is estimated to be approximately 12.5 MMBbl per month. Continued demand for fractionation and export capacity is expected to lead to other future growth opportunities.
9
As domestic producers have focused their drilling in crude oil and liquids-rich areas, new gas processing facilities are being built to accommodate liquids-rich gas, which contributes to the increasing supply of NGLs produced domestically. As drilling in these areas continues, the supply of NGLs requiring transportation and fractionation to market hubs is expected to continue to grow. As the supply of NGLs increases, our integrated Mont Belvieu and Galena Park Marine Terminal assets allow us to provide the raw product, fractionation, storage, interconnected terminaling, refrigeration and ship loading capabilities to support exports by third-party customers.
Drilling and production activity from liquids-rich natural gas shale plays and similar crude oil resource plays
We are actively pursuing natural gas gathering and processing and NGL transportation and fractionation opportunities associated with liquids-rich natural gas from shale and other resource plays and are actively pursuing crude gathering and/or purchases and sales, natural gas gathering, processing and/or purchases and sales and NGL transportation and fractionation opportunities from active crude oil resource plays. We believe that our leadership position in the Downstream Business, which includes our transportation, fractionation and export services, provides us with a competitive advantage relative to other midstream companies without these capabilities.
Organic growth and third-party acquisitions
We have a demonstrated track record of completing organic growth and third-party acquisitions and expect to continue to invest capital in our businesses to enhance our competitive advantage as an integrated midstream infrastructure company. We invested approximately $617 million in growth capital expenditures in 2020, or approximately $598 million, net of contributions from noncontrolling interests and including net contributions to investments in unconsolidated affiliates. These expansion investments are distributed across our businesses, with 39% to Gathering and Processing and 61% related to Logistics and Transportation. We currently estimate that we will invest approximately $350 to $450 million in net organic growth capital expenditures in 2021.
Competitive Strengths and Strategies
We believe that we are well positioned to execute our business strategies due to the following competitive strengths:
Strategically located gathering and processing asset base
Our gathering and processing businesses are strategically located in attractive oil and gas producing basins and are well positioned within each of those basins. Activity in the shale resource plays underlying our gathering assets is driven by the economics of oil, condensate, gas and NGL production from the particular reservoirs in each play. Activity levels for most of our gathering and processing assets are driven by commodity prices, primarily crude oil prices. Activity levels can impact the volumes of natural gas and crude oil available to us for gathering, processing and/or purchase and sale on our systems. Despite volatile and low commodity prices relative to historical levels, producers continue to focus drilling activity on their most attractive acreage, especially in the Permian Basin, where we have a large and well-positioned integrated footprint and are benefiting from rig activity in and around our systems.
Leading fractionation, LPG export and NGL infrastructure position
We are one of the largest fractionators of NGLs in the Gulf Coast. Our fractionation assets are primarily located in Mont Belvieu, Texas, and to a lesser extent Lake Charles, Louisiana, which are key market centers for NGLs. Our logistics operations at Mont Belvieu, the major U.S. hub of NGL infrastructure, include connections to a number of mixed NGL (“mixed NGLs” or “Y-grade”) supply pipelines, storage, interconnection and takeaway pipelines and other transportation infrastructure. Our logistics assets, including fractionation facilities, storage wells, low ethane propane de-ethanizer, and our Galena Park Marine Terminal and related pipeline systems and interconnects, are also located near and connected to key consumers of NGL products including the petrochemical and industrial markets. Grand Prix is one of the Y-grade supply pipelines that connects the very active Permian Basin to Mont Belvieu. The location and interconnectivity of these assets are not easily replicated, and we have additional capability to expand their capacity. We have extensive experience in operating these assets and developing, permitting and constructing new assets.
10
Comprehensive package of midstream services
We provide a comprehensive package of services to natural gas and crude oil producers. These services are essential to gather, process, treat, purchase and sell and transport wellhead gas to meet pipeline standards; extract, transport and fractionate NGLs for sale into petrochemical, industrial, commercial and export markets; and gather and/or purchase and sell crude oil. We believe that our ability to offer these integrated services provides us with an advantage in competing for new supplies because we can provide substantially all of the services that producers, marketers and others require for moving natural gas, NGLs and crude oil from wellhead to market on a cost-effective basis. Both Grand Prix and GCX further enhance our position to offer an integrated midstream service across the NGL and natural gas value chain by linking supply to key markets. Additionally, we believe that the significant investment we have made to construct and acquire assets in key strategic positions and the expertise we have in operating such assets make us well positioned to remain a leading provider of comprehensive services in the midstream sector.
High quality and efficient assets
Our gathering and processing systems and logistics and transportation assets consist of high-quality, well-maintained facilities, resulting in low-cost, efficient operations. Advanced technologies have been implemented for processing plants (primarily cryogenic units utilizing centralized control systems), measurement systems (essentially all electronic and electronically linked to a central data-base) and operations and maintenance management systems to manage work orders and implement preventative maintenance schedules (computerized maintenance management systems). These applications have allowed proactive management of our operations resulting in lower costs and minimal downtime. We have established a reputation in the midstream industry as a reliable and cost-effective supplier of services to our customers and have a track record of safe, efficient and reliable operation of our facilities. We will continue to pursue new contracts, cost efficiencies and operating improvements of our assets. Such improvements in the past have included new production and acreage commitments, reducing fuel gas and flare volumes and improving facility capacity and NGL recoveries. We will also continue to optimize existing plant assets to improve and maximize capacity and throughput.
In addition to routine annual maintenance expenses, our maintenance capital expenditures have averaged approximately $129 million per year over the last three years. We believe that our assets are well-maintained, and we are focused on continuing to operate both our existing and new assets in a prudent, safe and cost-effective manner.
Large, diverse business mix with favorable contracts and increasing fee-based business
We maintain gas gathering and processing positions in strategic oil and gas producing areas across multiple basins and provide these and other services under attractive contract terms, predominantly fee-based, to a diverse mix of producers across our areas of operation. Consequently, we are not dependent on any one oil and gas basin or counterparty. Our Logistics and Transportation assets are typically located near key market hubs and near most of our NGL customers. They also serve must-run portions of the natural gas and natural gas liquids value chain, are predominantly fee-based and have a diverse mix of customers.
Our contract portfolio has attractive rate and term characteristics including a significant fee-based component, especially in our Downstream Business. Our expected continued growth of the fee-based Downstream Business may result in increasing fee-based cash flow. Our Gathering and Processing segment contract mix also has significant components of fee-based margin, such as fee floors and other fee-based services which help mitigate against low commodity prices and may increase fee-based cash flow. Additionally, the long-term agreements with the investment grade energy company in the Delaware Basin for natural gas gathering and processing services and logistics and transportation services is fee-based. We continue to advance our initiative to reduce our commodity price exposure across our gathering and processing business by amending contracts or entering into new contracts with predominantly fee-based components and/or protections.
Financial flexibility
We have historically maintained sufficient liquidity and have funded our growth investments with a mix of equity, debt, asset sales and joint ventures over time in order to manage our leverage ratio. Disciplined management of liquidity, leverage and commodity price volatility allow us to be flexible in our long-term growth strategy and enable us to pursue large growth projects and strategic acquisitions.
Experienced and long-term focused management team
Our current executive management team possesses breadth and depth of experience working in the midstream energy business. Many members of our executive management team have managed our businesses prior to acquisition by Targa or joined shortly thereafter. Other officers and key employees have significant experience in the industry and with our assets and businesses.
11
Attractive cash flow characteristics
We believe that our strategy, combined with our high-quality asset portfolio, allows us to generate attractive cash flows. Geographic, business and customer diversity enhances our cash flow profile. Our Gathering and Processing segment contract mix has increasing components of fee-based margin driven by: (i) fees added to percent-of-proceeds contracts for natural gas treating and compression, (ii) new/amended contracts with a combination of percent-of-proceeds and fee-based components, including fee floors, and (iii) fee-based gas gathering and processing and crude oil gathering contracts. Contracts in our Coastal Gathering and Processing segment are primarily hybrid contracts (percent-of-liquids with a fee floor) or percent-of-liquids contracts (whereby we receive an agreed upon percentage of the actual proceeds of the NGLs). Contracts in the Downstream Business are predominantly fee-based (based on volumes and contracted rates), with a large take-or-pay component. Our contract mix, along with our commodity hedging program, serves to mitigate the impact of commodity price movements on cash flow.
We have hedged the commodity price risk associated with a portion of our expected natural gas, NGL and condensate equity volumes, future commodity purchases and sales, and transportation basis risk by entering into financially settled derivative transactions. These transactions include swaps, futures, purchased puts (or floors) and costless collars. The primary purpose of our commodity risk management activities is to hedge our exposure to price risk and to mitigate the impact of fluctuations in commodity prices on cash flow. We have intentionally tailored our hedges to approximate specific NGL products and to approximate our actual NGL and residue natural gas delivery points. Although the degree of hedging will vary, we intend to continue to manage some of our exposure to commodity prices by entering into similar hedge transactions. We also monitor and manage our inventory levels with a view to mitigate losses related to downward price exposure.
Asset base well-positioned for organic growth
We believe that our asset platform and strategic locations allow us to maintain and potentially grow our volumes and related cash flows as our supply areas benefit from continued exploration and development over time. Technology advances have resulted in increased domestic oil and liquids-rich gas drilling and production activity. The location of our assets provides us with access to natural gas and crude oil supplies and proximity to end-user markets and liquid market hubs while positioning us to capitalize on drilling and production activity in those areas. We believe that as global supply and demand for natural gas, crude oil and NGLs, and services for each grows over the long term, our infrastructure will increase in value as such infrastructure takes on increasing importance in meeting that growing supply and demand.
While we have set forth our strategies and competitive strengths above, our business involves numerous risks and uncertainties which may prevent us from executing our strategies. These risks include the adverse impact of changes in natural gas, NGL and condensate/crude oil prices, the supply of or demand for these commodities, and our inability to access sufficient additional production to replace natural declines in production. For a more complete description of the risks associated with an investment in us, see “Item 1A. Risk Factors.”
Our Business Operations
Our operations are reported in two segments: (i) Gathering and Processing, and (ii) Logistics and Transportation (also referred to as the Downstream Business).
Gathering and Processing Segment
Our Gathering and Processing segment consists of gathering, compressing, treating, processing, transporting and purchasing and selling natural gas and gathering, storing, terminaling and purchasing and selling crude oil. The gathering or purchase of natural gas consists of aggregating natural gas produced from various wells through varying diameter gathering lines to processing plants. Natural gas has a widely varying composition depending on the field, the formation and the reservoir from which it is produced. The processing of natural gas consists of the extraction of imbedded NGLs and the removal of water vapor and other contaminants to form (i) a stream of marketable natural gas, commonly referred to as residue gas, and (ii) a stream of mixed NGLs. Once processed, the residue gas is transported to markets through residue gas pipelines. End-users of residue gas include large commercial and industrial customers, as well as natural gas and electric utilities serving individual consumers. We sell our residue gas either directly to such end-users or to marketers into intrastate or interstate pipelines, which are typically located in close proximity or with ready access to our facilities. The gathering or purchase of crude oil consists of aggregating crude oil production through our pipeline gathering systems, which deliver crude oil to a combination of other pipelines, rail and truck.
12
We continually seek new supplies of natural gas and crude oil, both to offset the natural decline in production from connected wells and to increase throughput volumes. We obtain additional natural gas and crude oil supply in our operating areas by contracting for production from new wells or by capturing existing production currently gathered by others. Competition for new natural gas and crude oil supplies is based primarily on location of assets, commercial terms including pre-existing contracts, service levels and access to markets. The commercial terms of natural gas gathering and processing arrangements and crude oil gathering are driven, in part, by capital costs, which are impacted by the proximity of systems to the supply source and by operating costs, which are impacted by operational efficiencies, facility design and economies of scale.
The Gathering and Processing segment’s assets are located in the Permian Basin of West Texas and Southeast New Mexico (including the Midland, Central and Delaware Basins); the Eagle Ford Shale in South Texas; the Barnett Shale in North Texas; the Anadarko, Ardmore, and Arkoma Basins in Oklahoma (including the SCOOP and STACK) and South Central Kansas; the Williston Basin in North Dakota (including the Bakken and Three Forks plays) and in the onshore and near offshore regions of the Louisiana Gulf Coast and the Gulf of Mexico.
The natural gas processed in this segment is supplied through our gathering systems which, in aggregate, consist of approximately 28,700 miles of natural gas pipelines and include 42 owned and operated processing plants. During 2020, we processed an average of 4,398.3 MMcf/d of natural gas and produced an average of 528.9 MBbl/d of NGLs. In addition to our natural gas gathering and processing, the Badlands operations include a crude oil gathering system and four terminals with crude oil operational storage capacity of 205 MBbl, and our Permian operations include a crude oil gathering system and one terminal with crude oil operational storage capacity of 10 MBbl. In January 2020, we closed on the sale of the Delaware crude system, see “—Recent Developments—Asset Sales” above. During 2020, we purchased or gathered an aggregate average of 199.8 MBbl/d of crude oil in the Badlands and Permian.
The Gathering and Processing segment’s operations consist of (i) Permian Midland and Permian Delaware (also referred to as “Permian”), (ii) SouthTX, North Texas, SouthOK, WestOK (also referred to as “Central”), (iii) Coastal and (iv) Badlands each as described below:
Permian Midland
The Permian Midland system consists of approximately 7,000 miles of natural gas gathering pipelines and fifteen processing plants with an aggregate nameplate capacity of 2,399 MMcf/d, all located within the Permian Basin in West Texas. Ten of these plants and 4,900 miles of gathering pipelines belong to a joint venture (“WestTX”), in which we have an approximate 72.8% ownership. Pioneer, a major producer in the Permian Basin, owns the remaining interest in the WestTX system.
In addition, we are constructing the Heim Plant, a 200 MMcf/d cryogenic natural gas processing plant, which was relocated from our North Texas system to our Permian Midland system. The Heim Plant is expected to begin operations in the fourth quarter of 2021.
Permian Delaware
The Permian Delaware system consists of approximately 6,100 miles of natural gas gathering pipelines and eight processing plants with an aggregate capacity of 1,240 MMcf/d, all within the Delaware Basin in West Texas and Southeastern New Mexico.
The Permian Midland and Permian Delaware systems are interconnected and volumes may flow from one system to the other providing increased operational flexibility and redundancy.
SouthTX
The South Texas system contains approximately 870 miles of high-pressure and low-pressure gathering and transmission pipelines and three natural gas processing plants in the Eagle Ford Shale. The South Texas system processes natural gas through the Silver Oak I, Silver Oak II and Raptor gas processing plants. The Silver Oak I and II Plants (the “Silver Oak Plants”) are each 200 MMcf/d cryogenic plants. The Raptor Plant is a 260 MMcf/d cryogenic plant.
We participate in, and serve as operator for, two joint ventures in South Texas with a subsidiary of Southcross Energy Partners LLC, which consist of our 75% share in T2 LaSalle Gathering Company LLC (“T2 LaSalle”) and our 50% share in T2 Eagle Ford Gathering Company LLC (“T2 Eagle Ford”). T2 LaSalle owns approximately 60 miles of high-pressure gathering pipeline and T2 Eagle Ford owns approximately 120 miles of high-pressure gathering pipelines. Together, these two pipelines gather and transport gas to the Silver Oak Plants. T2 Eagle Ford also owns the residue gas delivery pipelines downstream of the Silver Oak Plants.
13
We also participate in a third joint venture in South Texas with Sanchez Midstream Partners LP (“Sanchez Midstream”). We own a 50% interest in the Carnero Joint Venture (“Carnero”) and Sanchez Midstream owns the remaining 50% interest. Carnero owns and Targa operates the Silver Oak II Plant, the Raptor Plant and approximately 45 miles of high-pressure gathering pipeline located in La Salle, Dimmitt and Webb Counties, Texas which connects Mesquite Energy’s Catarina Ranch gathering system and Comanche Ranch acreage to the Raptor Plant.
North Texas
North Texas includes the Chico gathering system in the Fort Worth Basin, which gathers gas from the Barnett Shale and Marble Falls plays for the Chico plant. The system consists of approximately 4,700 miles of pipelines gathering wellhead natural gas. The Chico plant has an aggregate processing capacity of 265 MMcf/d and an integrated fractionation capacity of 15 MBbl/d.
SouthOK
The SouthOK gathering system is located in the Ardmore and Anadarko Basins and includes the Golden Trend, SCOOP, and Woodford Shale areas of southern Oklahoma. The gathering system has approximately 2,000 miles of pipelines.
The SouthOK system includes six separate operational processing plants with a total nameplate capacity of 710 MMcf/d, including: the Coalgate, Stonewall, Hickory Hills and Tupelo facilities, which are owned by our Centrahoma Joint Venture, and our wholly-owned Velma and Velma V-60 plants. We have a 60% ownership interest in Centrahoma. The remaining 40% ownership interest in Centrahoma is held by MPLX, LP (“MPLX”).
WestOK
The WestOK gathering system is located in north central Oklahoma and southern Kansas’ Anadarko Basin and includes the Woodford shale and the STACK. The gathering system expands into 14 counties with approximately 6,600 miles of natural gas gathering pipelines.
The WestOK system has a total nameplate capacity of 400 MMcf/d with two separate cryogenic natural gas processing plants known as the Waynoka I and Waynoka II facilities.
Coastal
Our Coastal assets, located in and offshore South Louisiana, gather and process natural gas produced from shallow-water central and western Gulf of Mexico natural gas wells and from deep shelf and deep-water Gulf of Mexico production via connections to third-party pipelines or through pipelines owned by us. Coastal consists of approximately 2,075 MMcf/d of natural gas processing capacity, 11 MBbl/d of integrated fractionation capacity, 1,000 miles of onshore gathering system pipelines, and 170 miles of offshore gathering system pipelines. The processing plants are comprised of three wholly-owned and operated plants, one partially owned and operated plant, and one partially owned plant which is non-operated. Our Coastal plants have access to markets across the U.S. through the interstate natural gas pipelines to which they are interconnected. The industry continues to rationalize gas processing capacity along the western Louisiana Gulf Coast with most of the producer volumes going to more efficient plants, such as our Lowry and Gillis plants.
Badlands
The Badlands operations are located in the Bakken and Three Forks Shale plays of the Williston Basin in North Dakota and include approximately 510 miles of crude oil gathering pipelines, 120 MBbl of operational crude oil storage capacity at the Johnsons Corner Terminal, 30 MBbl of operational crude oil storage capacity at the Alexander Terminal, 30 MBbl of operational crude oil storage at New Town and 25 MBbl of operational crude oil storage at Stanley. The Badlands assets also include approximately 280 miles of natural gas gathering pipelines and the Little Missouri I-III natural gas processing plants, which have a gross processing capacity of approximately 90 MMcf/d. Additionally, Targa operates the 200 MMcf/d Little Missouri 4 plant (“LM4 Plant”), in which Targa Badlands and Hess Midstream Partners LP each own a 50% interest. Targa owns 55% of Targa Badlands through a joint venture with GSO Capital Partners and Blackstone Tactical Opportunities (collectively, “GSO”). The joint venture is a consolidated subsidiary and its financial results and related statistics are presented on a gross basis. Targa Badlands pays a minimum quarterly distribution (“MQD”) to GSO and Targa, with GSO having a priority right to the MQDs. Additionally, GSO’s capital contributions have a liquidation preference upon a sale of Targa Badlands. Targa Badlands is a discrete entity and the assets and credit of Targa Badlands are not available to satisfy the debts and other obligations of Targa or its other subsidiaries.
14
The following table lists the Gathering and Processing segment’s processing plants and related volumes for the year ended December 31, 2020:
|
Facility |
|
|
|
Process Type (1) |
|
|
|
Operated /Non-Operated |
|
|
|
% Owned |
|
|
|
|
Location |
|
|
|
Gross Processing Capacity (MMcf/d) (2) |
|
|
|
|
Gross Plant Natural Gas Inlet Throughput Volume (MMcf/d) (3) (4) (5) |
|
|
|
|
Gross NGL Production (MBbl/d) (3) (4) (5) |
|
||||
|
Permian Midland |
|
|
|
|
|
|
|
|
|
|
|
|
|
|
|
|
|
|
|
|
|
|
|
|
|
|
|
|
|
|
|
|
|
|
|
|
|
Consolidator (6) |
|
|
|
Cryo |
|
|
|
Operated |
|
|
|
|
72.8 |
|
|
|
|
Reagan County, TX |
|
|
|
|
150.0 |
|
|
|
|
|
|
|
|
|
|
|
|
|
|
Midkiff (6) |
|
|
|
Cryo |
|
|
|
Operated |
|
|
|
|
72.8 |
|
|
|
|
Reagan County, TX |
|
|
|
|
80.0 |
|
|
|
|
|
|
|
|
|
|
|
|
|
|
Driver (6) |
|
|
|
Cryo |
|
|
|
Operated |
|
|
|
|
72.8 |
|
|
|
|
Midland County, TX |
|
|
|
|
200.0 |
|
|
|
|
|
|
|
|
|
|
|
|
|
|
Benedum (6) |
|
|
|
Cryo |
|
|
|
Operated |
|
|
|
|
72.8 |
|
|
|
|
Upton County, TX |
|
|
|
|
45.0 |
|
|
|
|
|
|
|
|
|
|
|
|
|
|
Edward (6) |
|
|
|
Cryo |
|
|
|
Operated |
|
|
|
|
72.8 |
|
|
|
|
Upton County, TX |
|
|
|
|
200.0 |
|
|
|
|
|
|
|
|
|
|
|
|
|
|
Buffalo (6) |
|
|
|
Cryo |
|
|
|
Operated |
|
|
|
|
72.8 |
|
|
|
|
Martin County, TX |
|
|
|
|
200.0 |
|
|
|
|
|
|
|
|
|
|
|
|
|
|
Joyce (6) |
|
|
|
Cryo |
|
|
|
Operated |
|
|
|
|
72.8 |
|
|
|
|
Upton County, TX |
|
|
|
|
200.0 |
|
|
|
|
|
|
|
|
|
|
|
|
|
|
Johnson (6) |
|
|
|
Cryo |
|
|
|
Operated |
|
|
|
|
72.8 |
|
|
|
|
Midland County, TX |
|
|
|
|
200.0 |
|
|
|
|
|
|
|
|
|
|
|
|
|
|
Hopson (6) |
|
|
|
Cryo |
|
|
|
Operated |
|
|
|
|
72.8 |
|
|
|
|
Midland County, TX |
|
|
|
|
250.0 |
|
|
|
|
|
|
|
|
|
|
|
|
|
|
Pembrook (6) |
|
|
|
Cryo |
|
|
|
Operated |
|
|
|
|
72.8 |
|
|
|
|
Upton County, TX |
|
|
|
|
250.0 |
|
|
|
|
|
|
|
|
|
|
|
|
|
|
Mertzon |
|
|
|
Cryo |
|
|
|
Operated |
|
|
|
|
100.0 |
|
|
|
|
Irion County, TX |
|
|
|
|
52.0 |
|
|
|
|
|
|
|
|
|
|
|
|
|
|
Sterling |
|
|
|
Cryo |
|
|
|
Operated |
|
|
|
|
100.0 |
|
|
|
|
Sterling County, TX |
|
|
|
|
92.0 |
|
|
|
|
|
|
|
|
|
|
|
|
|
|
Tarzan |
|
|
|
Cryo |
|
|
|
Operated |
|
|
|
|
100.0 |
|
|
|
|
Martin County, TX |
|
|
|
|
10.0 |
|
|
|
|
|
|
|
|
|
|
|
|
|
|
High Plains |
|
|
|
Cryo |
|
|
|
Operated |
|
|
|
|
100.0 |
|
|
|
|
Midland County, TX |
|
|
|
|
220.0 |
|
|
|
|
|
|
|
|
|
|
|
|
|
|
Gateway (7) |
|
|
|
Cryo |
|
|
|
Operated |
|
|
|
|
100.0 |
|
|
|
|
Reagan County, TX |
|
|
|
|
250.0 |
|
|
|
|
|
|
|
|
|
|
|
|
|
|
|
|
|
|
|
|
|
|
|
|
|
|
|
|
|
|
|
|
Area Total |
|
|
|
|
2,399.0 |
|
|
|
|
|
1,745.6 |
|
|
|
|
|
250.8 |
|
|
Permian Delaware |
|
|
|
|
|
|
|
|
|
|
|
|
|
|
|
|
|
|
|
|
|
|
|
|
|
|
|
|
|
|
|
|
|
|
|
|
|
Sand Hills |
|
|
|
Cryo |
|
|
|
Operated |
|
|
|
|
100.0 |
|
|
|
|
Crane County, TX |
|
|
|
|
165.0 |
|
|
|
|
|
|
|
|
|
|
|
|
|
|
Loving |
|
|
|
Cryo |
|
|
|
Operated |
|
|
|
|
100.0 |
|
|
|
|
Loving County, TX |
|
|
|
|
70.0 |
|
|
|
|
|
|
|
|
|
|
|
|
|
|
Oahu |
|
|
|
Cryo |
|
|
|
Operated |
|
|
|
|
100.0 |
|
|
|
|
Pecos County, TX |
|
|
|
|
60.0 |
|
|
|
|
|
|
|
|
|
|
|
|
|
|
Wildcat |
|
|
|
Cryo |
|
|
|
Operated |
|
|
|
|
100.0 |
|
|
|
|
Winkler County, TX |
|
|
|
|
250.0 |
|
|
|
|
|
|
|
|
|
|
|
|
|
|
Falcon |
|
|
|
Cryo |
|
|
|
Operated |
|
|
|
|
100.0 |
|
|
|
|
Culberson County, TX |
|
|
|
|
250.0 |
|
|
|
|
|
|
|
|
|
|
|
|
|
|
Eunice (8) |
|
|
|
Cryo |
|
|
|
Operated |
|
|
|
|
100.0 |
|
|
|
|
Lea County, NM |
|
|
|
|
110.0 |
|
|
|
|
|
|
|
|
|
|
|
|
|
|
Monument (8) (9) |
|
|
|
Cryo |
|
|
|
Operated |
|
|
|
|
100.0 |
|
|
|
|
Lea County, NM |
|
|
|
|
85.0 |
|
|
|
|
|
|
|
|
|
|
|
|
|
|
Peregrine |
|
|
|
Cryo |
|
|
|
Operated |
|
|
|
|
100.0 |
|
|
|
|
Culberson County, TX |
|
|
|
|
250.0 |
|
|
|
|
|
|
|
|
|
|
|
|
|
|
|
|
|
|
|
|
|
|
|
|
|
|
|
|
|
|
|
|
Area Total |
|
|
|
|
1,240.0 |
|
|
|
|
|
729.4 |
|
|
|
|
|
99.1 |
|
|
SouthTX |
|
|
|
|
|
|
|
|
|
|
|
|
|
|
|
|
|
|
|
|
|
|
|
|
|
|
|
|
|
|
|
|
|
|
|
|
|
Silver Oak I |
|
|
|
Cryo |
|
|
|
Operated |
|
|
|
|
100.0 |
|
|
|
|
Bee County, TX |
|
|
|
|
200.0 |
|
|
|
|
|
|
|
|
|
|
|
|
|
|
Silver Oak II |
|
|
|
Cryo |
|
|
|
Operated |
|
|
|
|
50.0 |
|
|
|
|
Bee County, TX |
|
|
|
|
200.0 |
|
|
|
|
|
|
|
|
|
|
|
|
|
|
Raptor |
|
|
|
Cryo |
|
|
|
Operated |
|
|
|
|
50.0 |
|
|
|
|
La Salle County, TX |
|
|
|
|
260.0 |
|
|
|
|
|
|
|
|
|
|
|
|
|
|
|
|
|
|
|
|
|
|
|
|
|
|
|
|
|
|
|
|
Area Total |
|
|
|
|
660.0 |
|
|
|
|
|
248.1 |
|
|
|
|
|
26.1 |
|
|
North Texas |
|
|
|
|
|
|
|
|
|
|
|
|
|
|
|
|
|
|
|
|
|
|
|
|
|
|
|
|
|
|
|
|
|
|
|
|
|
Chico (10) |
|
|
|
Cryo |
|
|
|
Operated |
|
|
|
|
100.0 |
|
|
|
|
Wise County, TX |
|
|
|
|
265.0 |
|
|
|
|
|
|
|
|
|
|
|
|
|
|
Longhorn (11) |
|
|
|
Cryo |
|
|
|
Operated |
|
|
|
|
100.0 |
|
|
|
|
Wise County, TX |
|
|
|
|
200.0 |
|
|
|
|
|
|
|
|
|
|
|
|
|
|
|
|
|
|
|
|
|
|
|
|
|
|
|
|
|
|
|
|
Area Total |
|
|
|
|
465.0 |
|
|
|
|
|
201.6 |
|
|
|
|
|
23.9 |
|
|
SouthOK (12) |
|
|
|
|
|
|
|
|
|
|
|
|
|
|
|
|
|
|
|
|
|
|
|
|
|
|
|
|
|
|
|
|
|
|
|
|
|
Coalgate (13) |
|
|
|
Cryo |
|
|
|
Operated |
|
|
|
|
60.0 |
|
|
|
|
Coal County, OK |
|
|
|
|
80.0 |
|
|
|
|
|
|
|
|
|
|
|
|
|
|
Stonewall |
|
|
|
Cryo |
|
|
|
Operated |
|
|
|
|
60.0 |
|
|
|
|
Coal County, OK |
|
|
|
|
200.0 |
|
|
|
|
|
|
|
|
|
|
|
|
|
|
Tupelo |
|
|
|
Cryo |
|
|
|
Operated |
|
|
|
|
60.0 |
|
|
|
|
Coal County, OK |
|
|
|
|
120.0 |
|
|
|
|
|
|
|
|
|
|
|
|
|
|
Hickory Hills |
|
|
|
Cryo |
|
|
|
Operated |
|
|
|
|
60.0 |
|
|
|
|
Hughes County, OK |
|
|
|
|
150.0 |
|
|
|
|
|
|
|
|
|
|
|
|
|
|
Velma (13) |
|
|
|
Cryo |
|
|
|
Operated |
|
|
|
|
100.0 |
|
|
|
|
Stephens County, OK |
|
|
|
|
100.0 |
|
|
|
|
|
|
|
|
|
|
|
|
|
|
Velma V-60 |
|
|
|
Cryo |
|
|
|
Operated |
|
|
|
|
100.0 |
|
|
|
|
Stephens County, OK |
|
|
|
|
60.0 |
|
|
|
|
|
|
|
|
|
|
|
|
|
|
|
|
|
|
|
|
|
|
|
|
|
|
|
|
|
|
|
|
Area Total |
|
|
|
|
710.0 |
|
|
|
|
|
443.0 |
|
|
|
|
|
52.4 |
|
|
WestOK (12) |
|
|
|
|
|
|
|
|
|
|
|
|
|
|
|
|
|
|
|
|
|
|
|
|
|
|
|
|
|
|
|
|
|
|
|
|
|
Waynoka I |
|
|
|
Cryo |
|
|
|
Operated |
|
|
|
|
100.0 |
|
|
|
|
Woods County, OK |
|
|
|
|
200.0 |
|
|
|
|
|
|
|
|
|
|
|
|
|
|
Waynoka II |
|
|
|
Cryo |
|
|
|
Operated |
|
|
|
|
100.0 |
|
|
|
|
Woods County, OK |
|
|
|
|
200.0 |
|
|
|
|
|
|
|
|
|
|
|
|
|
|
|
|
|
|
|
|
|
|
|
|
|
|
|
|
|
|
|
|
Area Total |
|
|
|
|
400.0 |
|
|
|
|
|
249.5 |
|
|
|
|
|
20.3 |
|
|
Coastal |
|
|
|
|
|
|
|
|
|
|
|
|
|
|
|
|
|
|
|
|
|
|
|
|
|
|
|
|
|
|
|
|
|
|
|
|
|
Gillis (14) |
|
|
|
Cryo |
|
|
|
Operated |
|
|
|
|
100.0 |
|
|
|
|
Calcasieu Parish, LA |
|
|
|
|
180.0 |
|
|
|
|
|
|
|
|
|
|
|
|
|
|
Big Lake (13) |
|
|
|
Cryo |
|
|
|
Operated |
|
|
|
|
100.0 |
|
|
|
|
Calcasieu Parish, LA |
|
|
|
|
180.0 |
|
|
|
|
|
|
|
|
|
|
|
|
|
|
VESCO |
|
|
|
Cryo |
|
|
|
Operated |
|
|
|
|
76.8 |
|
|
|
|
Plaquemines Parish, LA |
|
|
|
|
750.0 |
|
|
|
|
|
|
|
|
|
|
|
|
|
|
Lowry |
|
|
|
Cryo |
|
|
|
Operated |
|
|
|
|
100.0 |
|
|
|
|
Cameron Parish, LA |
|
|
|
|
265.0 |
|
|
|
|
|
|
|
|
|
|
|
|
|
|
Sea Robin |
|
|
|
Cryo |
|
|
|
Non-operated |
|
|
|
|
0.9 |
|
|
|
|
Vermillion Parish, LA |
|
|
|
|
700.0 |
|
|
|
|
|
|
|
|
|
|
|
|
|
|
|
|
|
|
|
|
|
|
|
|
|
|
|
|
|
|
|
|
Area Total |
|
|
|
|
2,075.0 |
|
|
|
|
|
643.3 |
|
|
|
|
|
40.0 |
|
|
Badlands |
|
|
|
|
|
|
|
|
|
|
|
|
|
|
|
|
|
|
|
|
|
|
|
|
|
|
|
|
|
|
|
|
|
|
|
|
|
Little Missouri I-III (15) |
|
|
|
Cryo/RA |
|
|
|
Operated |
|
|
|
|
55.0 |
|
|
|
|
McKenzie County, ND |
|
|
|
|
90.0 |
|
|
|
|
|
|
|
|
|
|
|
|
|
|
Little Missouri IV |
|
|
|
RA |
|
|
|
Operated |
|
|
|
|
27.5 |
|
|
|
|
McKenzie County, ND |
|
|
|
|
200.0 |
|
|
|
|
|
|
|
|
|
|
|
|
|
|
|
|
|
|
|
|
|
|
|
|
|
|
|
|
|
|
|
|
Area Total |
|
|
|
|
290.0 |
|
|
|
|
|
137.8 |
|
|
|
|
|
16.3 |
|
|
|
|
|
|
|
|
|
|
|
|
|
|
|
|
|
|
|
|
Segment System Total |
|
|
|
|
8,239.0 |
|
|
|
|
|
4,398.3 |
|
|
|
|
|
528.9 |
|
15
|
(1) |
Cryo – Cryogenic Processing; RA – Refrigerated Absorption Processing. |
|
(2) |
Gross processing capacity represents 100% of ownership interests and may differ from nameplate processing capacity due to multiple factors including items such as compression limitations, and quality and composition of the gas being processed. |
|
(3) |
Plant natural gas inlet represents the volume of natural gas passing through the meter located at the inlet of the natural gas processing plant, except for Badlands which represents the total wellhead volume. |
|
(4) |
Plant natural gas inlet and NGL production volumes represent 100% of ownership interests for our consolidated VESCO joint venture, Silver Oak II, Raptor, Coalgate, Stonewall, Tupelo, and Hickory Hills plants and our ownership share of volumes for other partially owned plants that we proportionately consolidate based on our ownership interest which may be adjustable subject to an annual redetermination based on our proportionate share of plant production. |
|
(5) |
Per day Gross Plant Natural Gas Inlet and NGL Production statistics for plants listed above are based on the number of calendar days during 2020. |
|
(6) |
Gross plant natural gas inlet throughput volumes and gross NGL production volumes for WestTX are presented on a pro-rata net basis representing our undivided ownership interest in WestTX, which we proportionately consolidate in our financial statements. |
|
(7) |
As a result of a non-consent election made by the joint owner in our WestTX Permian Basin assets, the Gateway plant is 100% owned and consolidated by Targa until payout. |
|
(8) |
Includes throughput other than plant inlet, primarily from compressor stations. |
|
(9) |
The Monument plant has fractionation capacity of approximately 1.8 MBbl/d. |
|
(10) |
The Chico plant has fractionation capacity of approximately 15 MBbl/d. |
|
(11) |
The Longhorn Plant was shut down in October 2020 and will be relocated to our Permian Midland system as the Heim Plant. The Heim plant is expected to begin operations in the fourth quarter of 2021. |
|
(12) |
Certain processing facilities in these business units are capable of processing more than their nameplate capacity and when capacity is exceeded the facilities will off-load volumes to other processors, as needed. |
|
(13) |
Plant is available and operates subject to market conditions. |
|
(14) |
The Gillis plant has fractionation capacity of approximately 11 MBbl/d. |
|
(15) |
Little Missouri Trains I and II are refrigeration plants and Little Missouri Train III is a Cryo plant. |
Logistics and Transportation Segment
Our Logistics and Transportation segment is also referred to as our Downstream Business. Our Downstream Business includes the activities and assets necessary to transport and convert mixed NGLs into NGL products and also includes other assets and value-added services described below. The Logistics and Transportation segment includes Grand Prix, as well as our equity interest in GCX. The associated assets, including these pipelines, are generally connected to and supplied in part by our Gathering and Processing segment and, except for the pipelines and smaller terminals, are located predominantly in Mont Belvieu and Galena Park, Texas, and in Lake Charles, Louisiana. Our fractionation, pipeline transportation, storage and terminaling businesses include approximately 2,100 miles of company-owned pipelines to transport mixed NGLs and specification products.
The Logistics and Transportation segment also transports, distributes, purchases and sells and markets NGLs via terminals and transportation assets across the U.S. We own or market products at terminal facilities in a number of states, including Alabama, Arizona, California, Florida, Kentucky, Louisiana, Mississippi, New Jersey, Tennessee and Texas. The geographic diversity of our assets provides direct access to many NGL customers as well as markets via trucks, barges, ships, rail cars and open-access regulated NGL pipelines owned by third parties.
Additional description of the Logistics and Transportation segment assets and business activities associated with Pipelines, Fractionation, NGL Storage and Terminaling, NGL Distribution and Marketing, Wholesale Domestic Marketing, Refinery Services, Commercial Transportation and Natural Gas Marketing follows below.
Pipelines
Our primary pipeline assets are Grand Prix and our equity interest in GCX.
Grand Prix connects our gathering and processing positions throughout the Permian Basin, North Texas, and Southern Oklahoma (as well as third-party positions) to our fractionation and storage complex in the NGL market hub at Mont Belvieu, Texas. Grand Prix transports NGLs from the Permian Basin on a 24-inch diameter pipeline with a capacity of 410 MMBbl/d, expandable to 550 MMBbl/d, and from North Texas and Southern Oklahoma via pipeline of varying capacity, which both connect to a 30-inch diameter segment into Mont Belvieu. The final segment has a 450 MMBbl/d capacity, which is expandable to 950 MMBbl/d. We own a 56% interest in the Permian and Mont Belvieu segments of Grand Prix through the Grand Prix Joint Venture. Volumes flowing on the pipeline from the Permian Basin to Mont Belvieu accrue to the Grand Prix Joint Venture, while the volumes flowing from North Texas and Oklahoma to Mont Belvieu accrue solely to Targa’s benefit.
GCX connects the Waha hub in West Texas and other receipt points, including many of our Midland Basin processing facilities, to Agua Dulce in South Texas and other delivery points, and has a capacity of 2.0 Bcf/d. GCX DevCo JV, of which we own a 20% interest, owns a 25% interest in GCX, which is operated by Kinder Morgan Texas Pipeline LLC.
Additionally, through our 50% ownership interest in Cayenne Pipeline, LLC, we operate the Cayenne pipeline, which transports mixed NGLs from VESCO in Venice, Louisiana, to an interconnection with a third-party NGL pipeline in Toca, Louisiana.
16
Fractionation
After being extracted in the field, mixed NGLs are typically transported to a centralized facility for fractionation where the mixed NGLs are separated into discrete NGL products: ethane, ethane-propane mix, propane, normal butane, iso-butane and natural gasoline.
Contracts for our NGL fractionation services are fee-based arrangements. These fees are subject to adjustment for changes in certain fractionation expenses, including energy costs. The operating results of our NGL fractionation business are dependent upon the volume of mixed NGLs fractionated, the level of fractionation fees charged and product gains/losses from fractionation.
We believe that sufficient volumes of mixed NGLs will be available for fractionation in commercially viable quantities for the foreseeable future due to historical increases in NGL production from shale plays and other shale-technology-driven resource plays in areas of the U.S. that include Texas, New Mexico, Oklahoma and the Rockies and certain other basins accessed by pipelines to Mont Belvieu, as well as from conventional production of NGLs in areas such as the Permian Basin, Mid-Continent, East Texas, South Louisiana and shelf and deep-water Gulf of Mexico.
Although competition for NGL fractionation services is primarily based on the fractionation fee, the ability of an NGL fractionator to obtain mixed NGLs and distribute NGL products is also an important competitive factor. This ability is a function of the existence of storage infrastructure and supply and market connectivity necessary to conduct such operations. We believe that the location, scope and capability of our logistics assets, including our transportation and distribution systems, give us access to both substantial sources of mixed NGLs and a large number of end-use markets.
At our Mont Belvieu operated facility, we have eight fractionation trains, representing a gross capacity of 813.0 MBbl/d, including: (1) five fractionation trains with an aggregate capacity of 493.0 MBbl/d that are part of our 88%-owned Cedar Bayou Fractionators, (2) Train 6, a 100 MBbl/d fractionation train (“Train 6”), a joint venture between Targa and Stonepeak Infrastructure Partners (“Stonepeak”), in which Targa owns a 20% interest, (3) Train 7, a 110 MBbl/d fractionation train, a joint venture between Targa and Williams which began operations in the first quarter 2020, in which Targa owns an 80% equity interest, and (4) Train 8, a 110 MBbl/d fractionation train, which began operations late in the third quarter 2020 and is wholly-owned by Targa. Certain fractionation-related infrastructure for Train 6 and Train 7, such as storage caverns and brine handling, were funded and are owned 100% by Targa. Our fractionation trains are fully integrated with our existing Gulf Coast NGL storage, terminaling and delivery infrastructure, which includes an extensive network of connections to key petrochemical and industrial customers as well as our LPG export terminal at Galena Park on the Houston Ship Channel.
We additionally have a wholly-owned and operated fractionation facility in Lake Charles, Louisiana, representing a gross capacity of 55.0 MBbl/d.
In addition to our operated facilities, we hold an equity investment in, Gulf Coast Fractionators LP (“GCF”), also located at Mont Belvieu. In January 2021, the GCF facility was temporarily idled, but is available for reactivation, subject to prevailing market conditions and agreement with our partners. We will assume operatorship of GCF in the first half of 2021.
We also own fractionation assets at Chico, Monument and Gillis, which are included in our Gathering and Processing segment. In addition, we have a natural gasoline hydrotreater at Mont Belvieu, Texas that removes sulfur from natural gasoline, allowing customers to meet stringent fuel content standards. The facility has a capacity of 35 MBbl/d and is supported by long-term fee-based contracts that have certain guaranteed volume commitments and/or provisions for deficiency payments.
17
The following table details the Logistics and Transportation segment’s fractionation and treating facilities:
|
Facility |
|
% Owned |
|
|
Gross Capacity (MBbl/d) (1) |
|
|
Gross Throughput 2020 (MBbl/d) |
|
|||
|
Operated Facilities: |
|
|
|
|
|
|
|
|
|
|
|
|
|
Cedar Bayou Fractionators (Mont Belvieu, TX) (2) |
|
|
88.0 |
|
|
|
493.0 |
|
|
|
359.4 |
|
|
Train 6 Fractionator (Mont Belvieu, TX) |
|
|
20.0 |
|
|
|
100.0 |
|
|
|
109.0 |
|
|
Train 7 Fractionator (Mont Belvieu, TX) (3) |
|
|
80.0 |
|
|
|
110.0 |
|
|
|
94.7 |
|
|
Train 8 Fractionator (Mont Belvieu, TX) (4) |
|
|
100.0 |
|
|
|
110.0 |
|
|
|
27.5 |
|
|
Lake Charles Fractionator (Lake Charles, LA) (5) |
|
|
100.0 |
|
|
|
55.0 |
|
|
|
12.3 |
|
|
Targa LSNG Hydrotreater (Mont Belvieu, TX) |
|
|
100.0 |
|
|
|
35.0 |
|
|
|
38.9 |
|
|
Non-operated Facilities: |
|
|
|
|
|
|
|
|
|
|
|
|
|
Gulf Coast Fractionator (Mont Belvieu, TX) (6) |
|
|
38.8 |
|
|
|
135.0 |
|
|
|
68.2 |
|
________________
|
(1) |
Actual fractionation capacities may vary due to the composition of the NGLs being processed and does not contemplate ethane rejection. |
|
(2) |
Gross capacity represents 100% of the volume. Capacity includes 40 MBbl/d of additional back-end butane/gasoline fractionation capacity. |
|
(3) |
Train 7 began operations in the first quarter of 2020. |
|
(4) |
Train 8 began operations late in the third quarter of 2020. |
|
(5) |
Lake Charles Fractionator runs in a mode of ethane/propane splitting for a local petrochemical customer and is configured to handle raw product. |
|
(6) |
GCF was temporarily idled in January 2021. Targa will assume operatorship of GCF in the first half of 2021. The facility is available for reactivation, subject to prevailing market conditions and agreement with our partners. |
NGL Storage and Terminaling
In general, our NGL storage assets provide warehousing of mixed NGLs, NGL products and petrochemical products in underground wells, which allows for the injection and withdrawal of such products at various times in order to meet supply and demand cycles. Similarly, our terminaling operations provide the inbound/outbound logistics and warehousing of mixed NGLs, NGL products and petrochemical products in above-ground storage tanks. Our NGL underground storage and terminaling facilities serve single markets, such as propane, as well as multiple products and markets. For example, the Mont Belvieu and Galena Park facilities have extensive pipeline connections for mixed NGL supply and delivery of component NGLs, including Grand Prix. In addition, some of our facilities are connected to marine, rail and truck loading and unloading facilities that provide services and products to our customers. We provide long and short-term storage and terminaling services and throughput capability to third-party customers for a fee.
Across the Logistics and Transportation segment, we own 34 storage wells at our facilities with a gross NGL storage capacity of approximately 75 MMBbl, and operate 7 non-owned wells, the usage of which may be limited by brine handling capacity, which is utilized to displace NGLs from storage.
We operate our storage and terminaling facilities to support our key fractionation facilities at Mont Belvieu and Lake Charles for receipt of mixed NGLs and storage of fractionated NGLs to service the petrochemical, refinery, export and heating customers/markets as well as our wholesale domestic terminals that focus on logistics to service the heating market customer base. Our international export assets include our facilities at both Mont Belvieu and the Galena Park Marine Terminal near Houston, Texas, which have the capability to load propane, butanes and international grade low ethane propane. The facilities have an effective export capacity of up to 15 MMBbl per month, but given the mix of propane and butane demand, vessel size and availability of supply, and a variety of other factors, our effective working capacity is estimated to be approximately 12.5 MMBbl per month. We have the capability to load VLGC vessels, alongside small and medium sized export vessels. We continue to experience demand growth for U.S.-based NGLs (both propane and butane) for export into international markets and are in the process of enhancing our loading capabilities.
The following table details the Logistics and Transportation segment’s NGL storage and terminaling facilities:
|
Facility |
|
% Owned |
|
Location |
|
Description |
|
Throughput for 2020 (MMgal) |
|
|
Number of Operational Wells |
|
Gross Storage Capacity (MMBbl) |
|
|
Galena Park Marine Terminal (1) |
|
100 |
|
Harris County, TX |
|
NGL import/export terminal |
|
|
5,912.7 |
|
|
N/A |
|
0.7 |
|
Mont Belvieu Terminal & Storage |
|
100 |
|
Chambers County, TX |
|
Transport and storage terminal |
|
|
35,922.0 |
|
|
22 |
(2) |
54.1 |
|
Hackberry Terminal & Storage |
|
100 |
|
Cameron Parish, LA |
|
Storage terminal |
|
|
312.0 |
|
|
12 |
(3) |
20.9 |
|
Patriot |
|
100 |
|
Harris County, TX |
|
Dock and land for expansion (Not in service) |
|
N/A |
|
|
N/A |
|
N/A |
|
________________
|
(1) |
Volumes reflect total import and export across the dock/terminal and may include volumes that have also been handled at the Mont Belvieu Terminal. |
|
(2) |
Excludes seven non-owned wells which we operate on behalf of Chevron Phillips Chemical Company LLC . One additional well has been drilled and is being prepared for operations. One additional well is permitted. |
|
(3) |
Five of 12 owned wells leased to Citgo Petroleum Corporation under a long-term lease. |
18
NGL Distribution and Marketing
We market our own NGL production and also purchase component NGL products from other NGL producers and marketers for resale. Additionally, we also purchase product for resale in our Logistics and Transportation segment, including exports. During the year ended December 31, 2020, our distribution and marketing services business sold an average of 752.5 MBbl/d of NGLs.
We generally purchase mixed NGLs at a monthly pricing index less applicable fractionation, transportation and marketing fees and resell these component products to petrochemical manufacturers, refineries and other marketing and retail companies. This is primarily a physical settlement business in which we earn margins from purchasing and selling NGL products from customers under contract. We also earn margins by purchasing and reselling NGL products in the spot and forward physical markets. To effectively serve our distribution and marketing customers, we contract for and use many of the assets included in our Logistics and Transportation segment.
Wholesale Domestic Marketing
Our wholesale domestic propane marketing operations primarily sell propane and related logistics services to major multi-state retailers, independent retailers and other end-users. Our propane supply primarily originates from both our refinery/gas supply contracts and our other owned or managed Logistics and Transportation assets. We sell propane at a fixed posted price or at a market index basis at the time of delivery and in some circumstances, we earn margin on a netback basis.
The wholesale domestic propane marketing business is significantly impacted by seasonal and weather-driven demand, particularly in the winter, which can impact the price and volume of propane sold in the markets we serve.
Refinery Services
In our refinery services business, we typically provide NGL balancing services through contractual arrangements with refiners to purchase and/or market propane and to supply butanes. We use our commercial transportation assets (discussed below) and contract for and use the storage, transportation and distribution assets included in our Logistics and Transportation segment to assist refinery customers in managing their NGL product demand and production schedules. This includes both feedstocks consumed in refinery processes and the excess NGLs produced by other refining processes. Under typical netback purchase contracts, we generally retain a portion of the resale price of NGL sales or receive a fixed minimum fee per gallon on products sold. Under netback sales contracts, fees are earned for locating and supplying NGL feedstocks to the refineries based on a percentage of the cost to obtain such supply or a minimum fee per gallon.
Key factors impacting the results of our refinery services business include production volumes, prices of propane and butanes, as well as our ability to perform receipt, delivery and transportation services in order to meet refinery demand.
Commercial Transportation
Our NGL transportation and distribution infrastructure includes a wide range of assets supporting both third-party customers and the delivery requirements of our marketing and asset management business. We provide fee-based transportation services to refineries and petrochemical companies throughout the Gulf Coast area. Our assets are also deployed to serve our wholesale domestic distribution terminals, fractionation facilities, underground storage facilities and pipeline injection terminals. These distribution assets provide a variety of ways to transport products to and from our customers.
Our transportation assets, as of December 31, 2020, include 694 railcars that we lease and manage, 124 leased and managed transport tractors and 2 company-owned pressurized NGL barges.
19
The following table details the Logistics and Transportation segment’s raw NGL, propane and butane terminaling facilities:
|
Facility |
|
% Owned |
|
Location |
|
Description |
|
Throughput for 2020 (MMgal) (1) |
|
|
Usable Storage Capacity (MMgal) |
|
||
|
Fort Lauderdale Transload (2) |
|
100 |
|
Broward County, FL |
|
Butane transload |
|
|
0.3 |
|
|
|
— |
|
|
Jacksonville Transload (2) |
|
100 |
|
Duval County, FL |
|
Butane transload |
|
|
0.3 |
|
|
|
— |
|
|
Eagle Lake Transload (2) |
|
100 |
|
Polk County, FL |
|
Butane/propane transload |
|
|
4.7 |
|
|
|
— |
|
|
Greenville Terminal |
|
100 |
|
Washington County, MS |
|
Marine propane terminal |
|
|
20.8 |
|
|
|
1.5 |
|
|
Port Everglades Terminal |
|
100 |
|
Broward County, FL |
|
Marine propane terminal |
|
|
14.0 |
|
|
|
1.6 |
|
|
Calvert City Terminal |
|
100 |
|
Marshall County, KY |
|
Propane terminal |
|
|
5.9 |
|
|
|
0.1 |
|
|
Chattanooga Terminal |
|
100 |
|
Hamilton County, TN |
|
Propane terminal |
|
|
15.0 |
|
|
|
0.9 |
|
|
Hattiesburg Terminal (3) |
|
50 |
|
Forrest County, MS |
|
Propane terminal |
|
|
351.5 |
|
|
|
179.8 |
|
|
Sparta Terminal |
|
100 |
|
Sparta County, NJ |
|
Propane terminal |
|
|
13.0 |
|
|
|
0.2 |
|
|
Tyler Terminal |
|
100 |
|
Smith County, TX |
|
Propane terminal |
|
|
16.3 |
|
|
|
0.2 |
|
|
Winona Terminal |
|
100 |
|
Flagstaff County, AZ |
|
Propane terminal |
|
|
13.9 |
|
|
|
0.3 |
|
|
Abilene Transport (4) |
|
100 |
|
Taylor County, TX |
|
Raw NGL transport terminal |
|
|
— |
|
|
|
0.1 |
|
|
Bridgeport Transport (4) |
|
100 |
|
Jack County, TX |
|
Raw NGL transport terminal |
|
|
29.2 |
|
|
|
0.1 |
|
|
Gladewater Transport (4) |
|
100 |
|
Gregg County, TX |
|
Raw NGL transport terminal |
|
|
5.1 |
|
|
|
0.3 |
|
________________
|
(1) |
Throughputs include volumes related to exchange agreements and third-party storage agreements. |
|
(2) |
Rail-to-truck transload equipment. |
|
(3) |
Throughput volume reflects 100% of the facility capacity. |
|
(4) |
Volumes reflect total transport and injection volumes. |
Natural Gas Marketing
We also market natural gas available to us from the Gathering and Processing segment, purchase and resell natural gas in selected U.S. markets and manage the scheduling and logistics for these activities.
Seasonality
Overall, parts of our business are impacted by seasonality. Our downstream marketing business can be significantly impacted by seasonal and weather-driven demand, which can impact the price and volume of product sold in the markets we serve, as well as the level of inventory we hold in order to meet anticipated demand. See further discussion of the extent to which our business is affected by seasonality in “Item 1A. Risk Factors.”
Operational Risks and Insurance
We are subject to all risks inherent in the midstream natural gas, NGLs and crude oil businesses. These risks include, but are not limited to, explosions, fires, mechanical failure, cyber attacks, terrorist attacks, product spillage, weather, nature and inadequate maintenance of rights of way. These risks could result in damage to or destruction of operating assets and other property, or could result in personal injury, loss of life or environmental pollution, as well as curtailment or suspension of operations at the affected facility. Targa maintains, on behalf of us and our subsidiaries, general public liability, property, boiler and machinery and business interruption insurance in amounts that we consider to be appropriate for such risks. Such insurance is subject to deductibles or self-insured retentions that we consider reasonable and not excessive given the current insurance market environment.
The occurrence of a significant loss that is not insured, fully insured or indemnified against, or the failure of a party to meet its indemnification obligations, could materially and adversely affect our operations and financial condition. While we currently maintain levels and types of insurance that we believe to be prudent under current insurance industry market conditions, our inability to secure these levels and types of insurance in the future could negatively impact our business operations and financial stability, particularly if an uninsured loss were to occur. No assurance can be given that we will be able to maintain these levels of insurance in the future at rates considered commercially reasonable, particularly named windstorm coverage and contingent business interruption coverage for our onshore operations, and potentially excess liability insurance given the current insurance market environment.
20
Competition
We face strong competition in acquiring new natural gas or crude oil supplies. Competition for natural gas and crude oil supplies is primarily based on the location of gathering and processing facilities, pricing arrangements, reputation, efficiency, flexibility, treating capabilities (as applicable), reliability and access to end-use markets or liquid marketing hubs. Competitors to our gathering and processing operations include other natural gas gatherers and processors, such as major interstate and intrastate pipeline companies, master limited partnerships and oil and gas producers. Our major competitors for natural gas supplies in our current Permian and Central operating regions include DCP Midstream Partners (“DCP”), Enable Midstream Partners, L.P., Energy Transfer, L.P. (“Energy Transfer”), Enlink Midstream, LLC, Enterprise Products Partners L.P. (“Enterprise”), Kinder Morgan, Inc. (“Kinder Morgan”), MPLX, ONEOK, Inc. (“ONEOK”), WTG Gas Processing, L.P, Western Midstream Partners, L.P., and several other pipeline companies. Our competitors for the gathering and/or purchase and sale of crude oil in North Dakota include Crestwood Equity Partners L.P., Kinder Morgan, MPLX, Hess Midstream, L.P., Summit Midstream Partners, L.P., Paradigm Energy Partners LLC, and Oasis Midstream Partners L.P.
We also compete for NGL supplies for Grand Prix. Competition for NGL supplies is primarily based on the proximity of gathering and processing facilities in relation to one or more NGL pipelines, their connectivity to NGL pipeline takeaway options, access to end-use markets or liquid marketing hubs, pricing and contractual arrangements, reputation, efficiency, flexibility, and reliability. Competitors to our NGL pipeline include other midstream providers with NGL transportation capabilities, such as major interstate and intrastate pipeline companies, master limited partnerships and midstream natural gas and NGL companies. Our major competitors for NGL supplies in our current operating regions include DCP, Energy Transfer, Enterprise, ONEOK and EPIC Midstream Holdings, L.P.
Additionally, we face competition for mixed NGLs supplies at our fractionation facilities. The fractionators in which we own an interest in the Mont Belvieu region compete for volumes of mixed NGLs with other fractionators also located at Mont Belvieu, Texas. Among the primary competitors are Enterprise, Energy Transfer and ONEOK. In addition, certain producers fractionate mixed NGLs for their own account in captive facilities. The Mont Belvieu fractionators also compete on a more limited basis with fractionators in Conway, Kansas and a number of decentralized, smaller fractionation facilities in Texas, Louisiana and New Mexico. Our other fractionation facilities compete for mixed NGLs with the fractionators at Mont Belvieu as well as other fractionation facilities located in Louisiana. Our customers who are significant producers of mixed NGLs and NGL products or consumers of NGL products may develop their own fractionation facilities in lieu of using our services. Our primary competitors in providing export services to our customers are Enterprise, LoneStar and Phillips 66.
We also compete for NGL products to market through our Logistics and Transportation segment. Our competitors include major oil and gas producers who market NGL products for their own account and for others. Additionally, we compete with several other NGL marketing companies, including BP p.l.c., DCP, Energy Transfer, Enterprise and ONEOK.
Human Capital
We believe that our employees are the foundation to fostering the safe operation of our assets and delivery of services to our customers. We foster a collaborative, inclusive, and safety-minded work environment, focused on working safely every day. We seek to identify qualified internal and external talent for our organization, enabling us to execute on our strategic objectives.
We do not have any employees. To carry out our operations, Targa employed approximately 2,372 people as of December 31, 2020, that primarily support our operations. None of these employees are covered by collective bargaining agreements, and Targa considers its employee relations to be good.
Employee Health and Safety
Safety is a core value of ours and begins with the protection and safety of our employees, contractors and communities where we operate. We value people above all else and remain committed to making safety and health our top priority. We believe that “Zero is Achievable”, and our goal is to operate and deliver our products without any injuries. We continually seek to maintain and deepen our safety culture by providing a safe working environment that encourages active employee engagement, including implementing safety programs to achieve improvements in our safety culture.
To protect our employees, contractors, and surrounding community from workplace hazards and risks, we implement and maintain an integrated system of policies, practices, and controls, including requirements to complete regular detailed safety and regulatory compliance training for all applicable individuals.
21
In response to the ongoing COVID-19 pandemic, we moved early and quickly to protect the health and safety of our employees and are continuing to proactively manage our response to an evolving national and global situation. We took several strategic and proactive measures in response to information from the Centers for Disease Control and the local, state and national authorities to try to minimize the risk of business disruption and to protect our ability to deliver reliable services to our customers. Some of these actions include forming a COVID-19 task force of senior management to collaborate, review and execute our business response to the pandemic by instituting various safety protocols including tracking and managing the impact of COVID-19 positive employees and COVID-19 exposed employees, providing and requiring personal protective equipment at all facility locations, social distancing practices, work place build-out modifications, routine cleaning protocols at all facility locations to reduce virus contagion risk, protecting our workforce by providing our non-field employees with technology and equipment to perform their work duties remotely, where applicable, and implementing plans for safely returning to our offices over time.
Diversity and Inclusion
We are committed to fostering a work environment in which all employees treat each other with dignity and respect. This commitment extends to providing equal employment and advancement opportunities based on merit and experience. We believe this to be a fundamental principle and is defined in our Equal Employment Opportunity Policy and our Code of Conduct. We continually strive to attract a diverse workforce by partnering with local organizations to identify potential candidates to advance and strengthen our human capital management program.
Our employee demographic profile allows us to promote inclusion of thought, skill, knowledge, and culture across our operations to attract and maintain a high-quality workforce.
Talent Development and Retention
As a midstream infrastructure operator, we understand the importance of developing and fostering talent to ensure a skilled and talented diverse workforce both now and in the future. We value and provide opportunities for cross training and increased responsibilities, including leadership learning. These efforts allow us to recruit from within our organization for future vocational and occupational opportunities.
Our management promotes formal and informal learning and development throughout the organization. Candid feedback is provided to employees through our annual performance review process as well as informal meetings throughout the year.
We offer developmental programs focused on building the skills of our employees and to help advance employee careers, knowledge, and skillsets through training and related programs.
To help plan and predict succession needs, we perform annual succession plans, which are discussed and reviewed with management and, for certain levels and positions, with the board of directors. We additionally monitor employee turnover rates and conduct exit interviews with employees who voluntarily leave the company to better understand their reasons for leaving the company.
Regulation of Operations
Regulation of pipeline gathering and transportation services, natural gas, NGL and crude oil sales, and transportation of natural gas, NGLs and crude oil may affect certain aspects of our business and the market for our products and services.
Natural Gas Gathering and Processing Regulation
Our natural gas gathering operations are typically subject to open access ratable take and/or common purchaser statutes (and implementing rules) in the states in which we operate. The common purchaser statutes generally require gathering pipelines to purchase or take without undue discrimination, while open access gathering requirements generally give producers access to gathering services on terms that are not unduly discriminatory. In one instance, the governing law prohibits undue discrimination with respect to purchase or processing of natural gas. The regulations under these statutes can have the effect of imposing some restrictions on our ability as an owner of gathering and processing facilities to decide with whom (and on what terms) we contract to gather or process natural gas with similarly situated customers (subject, in each case, to the limitations and requirements of each jurisdiction). The states in which we operate have adopted complaint-based regulation of natural gas gathering activities, which allows natural gas producers and shippers to file complaints with state regulators in an effort to resolve grievances relating to access and rate discrimination. We cannot predict whether such a complaint will be filed against us in the future. Failure to comply with state regulations can result in the imposition of administrative, civil and, in certain cases, criminal penalties.
22
Section 1(b) of the Natural Gas Act of 1938 (“NGA”) exempts natural gas gathering facilities from regulation as a natural gas company by FERC under the NGA. We believe that the natural gas pipelines in our gathering systems meet the traditional tests FERC has used to establish a pipeline’s status as a gatherer not subject to regulation as a natural gas company. However, to the extent our gathering systems buy and sell natural gas, such gatherers, in their capacity as buyers and sellers of natural gas, are now subject to Order No. 704. See “—Regulation of Operations—FERC Market Transparency Rules.”
Our natural gas gathering and processing operations are not presently subject to FERC regulation. However, since May 2009, we have been required to report to FERC information regarding natural gas sale and purchase transactions for some of our operations depending on the volume of natural gas transacted during the prior calendar year. See “—Regulation of Operations—FERC Market Transparency Rules.”
Sales of Natural Gas, NGLs and Crude Oil
The price at which we buy and sell natural gas, NGLs and crude oil is currently not subject to federal rate regulation and, for the most part, is not subject to state rate regulation. However, with regard to our physical purchases and sales of these energy commodities and any related hedging activities that we undertake, we are required to observe anti-market manipulation laws and related regulations enforced by FERC and/or the Commodities Futures Trading Commission (“CFTC”). See “—Regulation of Operations—EP Act of 2005.” Since May 2009, we have been required to report to FERC information regarding natural gas sale and purchase transactions for some of our operations depending on the volume of natural gas transacted during the prior calendar year. See “—Regulation of Operations—FERC Market Transparency Rules.” Should we violate the anti-market manipulation laws and regulations, we could also be subject to related third-party damage claims by, among others, market participants, sellers, royalty owners and taxing authorities.
Interstate Natural Gas
We own (in conjunction with Pioneer) and operate the Driver Residue Pipeline, a gas transmission pipeline extending from our Driver processing plant in West Texas approximately ten miles to points of interconnection with intrastate and interstate natural gas transmission pipelines. We have obtained a certificate of public convenience and necessity from FERC waiving certain of the Commission’s tariff and rate regulations. If, however, we receive a bona fide request for firm service on the Driver Residue Pipeline from a third party, FERC would reexamine the waivers it has granted us and would require us to file for authorization to offer “open access” transportation under its regulations, which would impose additional costs upon us.
Interstate Liquids
Targa NGL Pipeline Company LLC (“Targa NGL”), Targa Gulf Coast NGL Pipeline LLC (“Targa Gulf Coast”), and the Grand Prix Joint Venture have interstate NGL pipelines that are considered common carrier pipelines subject to regulation by FERC under the Interstate Commerce Act (the “ICA”). Targa Gulf Coast leases from Targa NGL certain pipelines that run between Mont Belvieu, Texas, and Galena Park, Texas and between Mont Belvieu, Texas, and Lake Charles, Louisiana. Each of these pipelines is part of an extensive mixed NGL and purity NGL pipeline receipt and delivery system that provides services to domestic and foreign import and export customers.
In 2019, Targa NGL began operating portions of Grand Prix that transports NGLs from Oklahoma to Mont Belvieu, Texas. On July 27, 2018, Targa NGL submitted a petition for declaratory order to FERC on a proposed rate structure and terms of service for such portions of Grand Prix. The Commission granted Targa NGL’s petition for declaratory order subject to certain conditions on March 11, 2019. Targa NGL requested rehearing on April 10, 2019, which is pending at FERC. On August 6, 2020, Targa NGL submitted a petition for declaratory order to FERC on a proposed rate structure and terms of service related to the Central Oklahoma Extension of Grand Prix, and on October 1, 2020, FERC issued an order granting Targa NGL’s petition in full. Additionally, Grand Prix entered full service during the third quarter of 2019, providing transportation for mixed NGLs from the Permian Basin, including points in New Mexico, to Mont Belvieu, Texas.
Unless covered by a waiver, as described below, the ICA requires that we maintain tariffs on file with FERC for interstate movements of liquids on our pipelines. Those tariffs set forth the rates we charge for providing transportation services as well as the rules and regulations governing these services. The ICA requires, among other things, that rates on interstate common carrier pipelines be “just and reasonable” and non-discriminatory.
Targa has multiple NGL pipelines that have qualified for a waiver of applicable FERC regulatory requirements under the ICA based on current circumstances. Additionally, the crude oil pipeline system that is part of the Badlands assets also qualifies for such a waiver.
23
All such waivers are subject to revocation, however, should a particular pipeline’s circumstances change. FERC could, either at the request of other entities or on its own initiative, assert that some or all of these pipelines no longer qualify for a waiver. In the event that FERC were to determine that one more of these pipelines no longer qualified for waiver, we would likely be required to file a tariff with FERC for the applicable pipeline(s) and delivery point(s), provide a cost justification for the transportation charge, and provide service to all potential shippers without undue discrimination.
Tribal Lands
Our intrastate natural gas pipelines in North Dakota are subject to the various regulations of the State of North Dakota. In addition, various federal agencies within the U.S. Department of the Interior, particularly the federal Bureau of Land Management (“BLM”), Office of Natural Resources Revenue (formerly the Minerals Management Service) and the Bureau of Indian Affairs, as well as the Three Affiliated Tribes, promulgate and enforce regulations pertaining to operations on the Fort Berthold Indian Reservation. Please see “Other State and Local Regulation of Operations” below.
Intrastate Natural Gas
Though our natural gas intrastate pipelines are not subject to regulation by FERC as natural gas companies under the NGA, our intrastate pipelines may be subject to certain FERC-imposed reporting requirements depending on the volume of natural gas purchased or sold in a given year. See “—Regulation of Operations—FERC Market Transparency Rules.”
Our intrastate pipelines located in Texas are regulated by the Railroad Commission of Texas (the “RRC”) and are required to have tariffs on file with the RRC. Some of these Texas intrastate pipelines also transport natural gas in interstate commerce pursuant to Section 311 of the Natural Gas Policy Act of 1978 (“NGPA”). Under Sections 311 and 601 of the NGPA, an intrastate pipeline may transport natural gas in interstate commerce without becoming subject to FERC regulation as a “natural-gas company” under the NGA, but must file the terms and conditions of transportation of natural gas under authority of Section 311 with FERC, and these terms and conditions must be “fair and equitable.” Specifically, TPL SouthTex Transmission Company LP (“TPL SouthTex Transmission”) and Targa Midland Gas Pipeline LLC (“Targa Midland”) provide NGPA Section 311 service.
Our Louisiana intrastate pipeline, Targa Louisiana Intrastate LLC, and the rates and terms of service on the pipeline are subject to regulation by the Office of Conservation of the Louisiana Department of Natural Resources (“DNR”).
We also operate natural gas pipelines that extend from the tailgate of our processing plants to interconnections with both intrastate and interstate natural gas pipelines. We believe these pipelines are exempt from FERC’s jurisdiction under the Natural Gas Act under FERC’s “stub” line exemption. Texas and Louisiana have adopted complaint-based regulation of intrastate natural gas transportation activities, which allows natural gas producers and shippers to file complaints with state regulators in an effort to resolve grievances relating to pipeline access and rate discrimination. The rates we charge for intrastate transportation are deemed just and reasonable unless challenged in a complaint. A complaint also can be filed with FERC regarding the rates, terms, and conditions of service on our pipelines providing service pursuant to Section 311 of the NGPA. We cannot predict whether such a complaint will be filed against us in the future. Failure to comply with state or FERC regulations can result in the imposition of administrative, civil and criminal penalties.
Intrastate Liquids
Our intrastate NGL pipelines in Texas transport mixed and purity NGL streams between Targa’s Mont Belvieu and Galena Park, Texas facilities. Grand Prix went into service during the third quarter of 2019, and provides transportation of mixed NGLs from the Permian Basin to Mont Belvieu, Texas. Further, we operate crude gathering pipelines in the Permian Basin. With respect to intrastate movements, these pipelines are not subject to FERC regulation, but are subject to rate regulation by the RRC.
Our intrastate NGL pipelines in Louisiana gather mixed NGLs streams that we own from processing plants in Louisiana and deliver such streams to the Gillis and Lake Charles fractionators in Lake Charles, Louisiana. We deliver mixed and purity NGL streams out of our fractionator to and from Targa-owned storage, to other third-party facilities and pipelines in Louisiana. Additionally, through our 50% ownership interest in Cayenne Pipeline, LLC, we operate the Cayenne pipeline, which transports mixed NGLs from the Venice gas plant in Venice, Louisiana, to an interconnection with a third-party NGL pipeline in Toca, Louisiana. These pipelines are not subject to FERC regulation or rate regulation by the DNR. On May 9, 2019, the Louisiana Public Service Commission (“LPSC”) approved applications to register certain pipelines of Cayenne Pipeline, LLC and Targa Downstream LLC in accordance with the LPSC 2015 General Order, Docket No. R-33390.
24
EP Act of 2005
The EP Act of 2005 is a comprehensive compilation of tax incentives, authorized appropriations for grants and guaranteed loans, and significant changes to the statutory policy that affects all segments of the energy industry. Among other matters, the EP Act of 2005 amends the NGA to add an anti-market manipulation provision which makes it unlawful for any entity to engage in prohibited behavior to be prescribed by FERC, and furthermore provides FERC with additional civil penalty authority. The EP Act of 2005 provides FERC with the power to assess civil penalties up to a maximum amount that is adjusted annually for inflation, which for 2021 equals approximately $1.3 million per violation per day for violations of the NGA and approximately $1.3 million per violation per day for violations of the NGPA. The civil penalty provisions are applicable to entities that engage in the sale of natural gas for resale in interstate commerce as well as entities that are otherwise subject to the NGA or NGPA. In 2006, FERC issued Order No. 670 to implement the anti-market manipulation provision of the EP Act of 2005. Order No. 670 does not apply to activities that relate only to intrastate or other non-jurisdictional sales or gathering, but does apply to activities of gas pipelines and storage companies that provide interstate services, as well as otherwise non-jurisdictional entities to the extent the activities are conducted “in connection with” gas sales, purchases or transportation subject to FERC jurisdiction, which includes the annual reporting requirements under a final rule on the annual natural gas transaction reporting requirements, as amended by subsequent orders on rehearing (Order No. 704), and the quarterly reporting requirement under Order No. 735. The anti-market manipulation rule and enhanced civil penalty authority reflect an expansion of FERC’s NGA enforcement authority.
FERC Market Transparency Rules
Beginning in 2007, FERC has issued a number of rules intended to provide for greater marketing transparency in the natural gas industry, including Order Nos. 704, 720, and 735. Under Order No. 704, wholesale buyers and sellers of more than 2.2 Bcf of physical natural gas in the previous calendar year, including interstate and intrastate natural gas pipelines, natural gas gatherers, natural gas processors and natural gas marketers, are now required to report, on May 1 of each year, aggregate volumes of natural gas purchased or sold at wholesale in the prior calendar year to the extent such transactions utilize, contribute to, or may contribute to the formation of price indices.
Under Order No. 720, certain non-interstate pipelines delivering, on an annual basis, more than an average of 50 million MMBtu of gas over the previous three calendar years, are required to post on a daily basis certain information regarding the pipeline’s capacity and scheduled flows for each receipt and delivery point that has a design capacity equal to or greater than 15,000 MMBtu/d and interstate pipelines are required to post information regarding the provision of no-notice service. In October 2011, Order No. 720 as clarified was vacated by the Court of Appeals for the Fifth Circuit. We take the position that, at this time, all of our entities are exempt from Order No. 720 as currently effective.
Under Order No. 735, intrastate pipelines providing transportation services under Section 311 of the NGPA and Hinshaw pipelines operating under Section 1(c) of the NGA are required to report on a quarterly basis more detailed transportation and storage transaction information, including: rates charged by the pipeline under each contract; receipt and delivery points and zones or segments covered by each contract; the quantity of natural gas the shipper is entitled to transport, store, or deliver; the duration of the contract; and whether there is an affiliate relationship between the pipeline and the shipper. Order No. 735 also extends FERC’s periodic review of the rates charged by the subject pipelines from three years to five years. On rehearing, FERC reaffirmed Order No. 735 with some modifications. As currently written, this rule does not apply to our Hinshaw pipelines.
Additional proposals and proceedings that might affect the natural gas industry are pending before Congress, FERC and the courts. We cannot predict the ultimate impact of these or the above regulatory changes to our natural gas operations. We do not believe that we would be affected by any such FERC action materially differently than other midstream natural gas companies with whom we compete.
Other State and Local Regulation of Operations
Our business activities are subject to various state and local laws and regulations, as well as orders of regulatory bodies pursuant thereto, governing a wide variety of matters, including operations, marketing, production, pricing, community right-to-know, protection of the environment, safety, marine traffic and other matters. In addition, the Three Affiliated Tribes promulgate and enforce regulations pertaining to operations on the Fort Berthold Indian Reservation, on which we operate a significant portion of our Badlands gathering and processing assets. The Three Affiliated Tribes is a sovereign nation having the right to enforce certain laws and regulations independent from federal, state and local statutes and regulations. For additional information regarding the potential impact of federal, state, tribal or local regulatory measures on our business, see “Risk Factors—Risks Related to Our Business.”
25
Environmental and Occupational Health and Safety Matters
Our business operations are subject to numerous environmental and occupational health and safety laws and regulations that may be imposed at the federal, regional, state, tribal and local levels. The activities that we conduct in connection with (i) gathering, compressing, treating, processing, transporting and purchasing and selling natural gas; (ii) storing, fractionating, treating, transporting and selling NGLs and NGL products, including services to LPG exporters; and (iii) gathering, storing, terminaling and purchasing and selling crude oil are subject to or may become subject to stringent environmental regulation. We have implemented programs and policies designed to monitor and pursue operation of our pipelines, plants and other facilities in a manner consistent with existing environmental and occupational health and safety laws and regulations, and have incurred and will continue to incur operating and capital expenditures, some of which may be material, to comply with these laws and regulations. Historically, our environmental compliance costs have not had a material adverse effect on our results of operations; however, there can be no assurance that such costs will not be material in the future or that such future compliance will not have a material adverse effect on our business and operational results.
The more significant of these existing environmental and occupational health and safety laws and regulations include the following U.S. legal standards, as amended from time to time:
|
|
• |
the Clean Air Act ("CAA"), which restricts the emission of air pollutants from many sources and imposes various pre-construction, operational, monitoring and reporting requirements, and that the EPA has relied upon as authority for adopting climate change regulatory initiatives relating to greenhouse gas ("GHG") emissions; |
|
|
• |
the Federal Water Pollution Control Act, also known as the Clean Water Act, which regulates discharges of pollutants to state and federal waters and establishes the extent to which waterways are subject to federal jurisdiction and rulemaking as protected waters of the United States; |
|
|
• |
the Comprehensive Environmental Response, Compensation and Liability Act of 1980 ("CERCLA"), which imposes liability on generators, transporters, disposers and arrangers of hazardous substances at sites where hazardous substance releases have occurred or are threatening to occur; |
|
|
• |
the Resource Conservation and Recovery Act ("RCRA"), which governs the generation, treatment, storage, transport, and disposal of solid wastes, including hazardous wastes; |
|
|
• |
the Oil Pollution Act of 1990, which subjects owners and operators of onshore facilities, pipelines and other facilities, as well as lessees or permittees of areas in which offshore facilities are located, that are the site of an oil spill in waters of the United States, to liability for removal costs and damages; |
|
|
• |
the Safe Drinking Water Act, which ensures the quality of the nation’s public drinking water through adoption of drinking water standards and controlling the injection of waste fluids into below-ground formations that may adversely affect drinking water sources; |
|
|
• |
the Endangered Species Act, which restricts activities that may affect federally identified endangered and threatened species or their habitats through the implementation of operating restrictions or a temporary, seasonal, or permanent ban in affected areas; |
|
|
• |
the National Environmental Policy Act (NEPA), which requires federal agencies to evaluate major agency actions having the potential to impact the environment and that may require the preparation of environmental assessments and more detailed environmental impact statements that may be made available for public review and comment; and |
|
|
• |
the Occupational Safety and Health Act, which establishes workplace standards for the protection of the health and safety of employees, including the implementation of hazard communications programs designed to inform employees about hazardous substances in the workplace, potential harmful effects of these substances, and appropriate control measures. |
26
These environmental and occupational health and safety laws and regulations generally restrict the level of substances generated as a result of our operations that may be emitted to ambient air, discharged to surface water, and disposed or released to surface and below-ground soils and ground water. Additionally, there exist tribal, state and local jurisdictions in the United States where we operate that also have, or are developing or considering developing, similar environmental and occupational health and safety laws and regulations governing many of these same types of activities. Any failure by us to comply with these laws and regulations may result in the assessment of sanctions, including administrative, civil, and criminal penalties; the imposition of investigatory, remedial, and corrective action obligations or the incurrence of capital expenditures; the occurrence of restrictions, delays or cancellations in the permitting, development or expansion of projects; and the issuance of injunctions restricting or prohibiting some or all of our activities in a particular area. Certain environmental laws also provide for citizen suits, which allow individuals or organizations to act in place of the government and sue operators for alleged violations of environmental law. The ultimate financial impact arising from environmental laws and regulations is neither clearly known nor determinable as existing standards are subject to change and new standards continue to evolve.
We own, lease, or operate numerous properties that have been used for crude oil and natural gas midstream services for many years. Additionally, some of our properties have been operated by third parties or by previous owners or operators whose treatment and disposal of hazardous substances, wastes, or petroleum hydrocarbons was not under our control. Under environmental laws such as CERCLA and RCRA, we could incur strict joint and several liability due to damages to natural resources as well as for remediating hydrocarbons, hazardous substances or wastes disposed of or released by us or prior owners or operators. We also could incur costs related to the clean-up of third-party sites to which we sent regulated substances for disposal or to which we sent equipment for cleaning, and for damages to natural resources or other claims related to releases of regulated substances at or from such third-party sites.
Over time, the trend in environmental and occupational health and safety regulation is to typically place more restrictions and limitations on activities that may adversely affect the environment or expose workers to injury and thus, any changes in environmental or occupational health and safety laws and regulations or reinterpretation of enforcement policies that may arise in the future and result in more stringent or costly waste management or disposal, pollution control, remediation or occupational health and safety-related requirements could have a material adverse effect on our business, results of operations and financial position. We may not have insurance or be fully covered by insurance against all environmental and occupational health and safety risks, and we may be unable to pass on increased compliance costs arising out of such risks to our customers. We review regulatory and environmental issues as they pertain to us and we consider regulatory and environmental issues as part of our general risk management approach. For more information on environmental and occupational health and safety matters, see the following Risk Factors under Part I, Item 1A of this Form 10-K: “Our operations are subject to environmental laws and regulations and a failure to comply or an accidental release into the environment may cause us to incur significant costs and liabilities,” “We could incur significant costs in complying with more stringent occupational safety and health requirements,” “Laws and regulations regarding hydraulic fracturing could result in restrictions, delays or cancellations in drilling and completing new oil and natural gas wells by our customers, which could adversely impact our revenues by decreasing the volumes of natural gas, NGLs or crude oil through our facilities and reducing the utilization of our assets,” and “Our and our customers’ operations are subject to a series of risks arising out of the threat of climate change (including legislation or regulation to address climate change) that could result in increased operating costs, limit the areas in which oil and natural gas production may occur, and reduce demand for the products and services we provide.”
27
Pipeline Safety Matters
Many of our natural gas, NGL and crude oil pipelines are subject to regulation by the federal Pipeline and Hazardous Materials Safety Administration (“PHMSA”), an agency of the U.S. Department of Transportation (“DOT”), under the Natural Gas Pipeline Safety Act of 1968, as amended (“NGPSA”), with respect to natural gas, and the Hazardous Liquids Pipeline Safety Act of 1979, as amended (“HLPSA”), with respect to crude oil, NGLs and condensates. The NGPSA and HLPSA govern the design, installation, testing, construction, operation, replacement and management of natural gas, crude oil, NGL and condensate pipeline facilities. Pursuant to these acts, PHMSA has promulgated regulations governing, among other things, pipeline design, maximum operating pressures, pipeline patrols and leak surveys, public awareness, operation and maintenance procedures, operator qualification, minimum depth requirements and emergency procedures, as well as other matters intended to ensure adequate protection for the public and to prevent accidents and failures. Additionally, PHMSA has promulgated regulations requiring pipeline operators to develop and implement integrity management programs to comprehensively evaluate certain relatively higher risk areas, known as high consequence areas (“HCAs”) and moderate consequence areas (“MCAs”) along pipelines and take additional safety measures to protect people and property in these areas. The HCAs for natural gas, crude oil, NGL and condensate pipelines impose increasing safety-related requirements as the population density or ecological sensitivity increases. An MCA is defined in relation to natural gas pipelines and is based on high-population areas as well as certain principal, high-capacity roadways, though it does not meet the definition of a natural gas pipeline HCA. Various states have also adopted regulations, similar to existing PHMSA regulations for, and may have established agencies analogous to PHMSA to regulate, intrastate gathering and transmission lines. Historically, our pipeline safety compliance costs have not had a material adverse effect on our results of operations; however, there can be no assurance that such costs will not be material in the future or that such future compliance will not have a material adverse effect on our business, financial condition or results of operations. See Risk Factors “We may incur significant costs and liabilities resulting from performance of pipeline integrity programs and related repairs” and “Federal and state legislative and regulatory initiatives relating to pipeline safety that require the use of new or more stringent safety controls or result in more stringent enforcement of applicable legal requirements could subject us to increased capital costs, operational delays and costs of operation” under Item 1A of this Form 10-K for further discussion on pipeline safety standards, including integrity management requirements.
Title to Properties and Rights of Way
Our real property falls into two categories: (1) parcels that we own in fee and (2) parcels in which our interest derives from leases, easements, rights of way, permits or licenses from landowners or governmental authorities permitting the use of such land for our operations. Portions of the land on which our plants and other major facilities are located are owned by us in fee title and we believe that we have satisfactory title to these lands. The remainder of the land on which our plant sites and major facilities are located are held by us pursuant to ground leases or easements between us, as lessee or grantee, and the fee owner of the lands, as lessors or grantors. We and our predecessors have leased or held easements on these lands for many years without any material challenge known to us relating to the title to the land upon which the assets are located, and we believe that we have satisfactory leasehold or easement estates to such lands. We have no knowledge of any challenge to the underlying fee title of any material lease, easement, rights of way, permit, lease or license, and we believe that we have satisfactory title to all of our material leases, easements, rights of way, permits, leases and licenses.
Financial Information by Reportable Segment
See “Segment Information” included under Note 23 of the “Consolidated Financial Statements” for a presentation of financial results by reportable segment and see “Item 7. Management’s Discussion and Analysis of Financial Condition and Results of Operations–By Reportable Segment” for a discussion of our financial results by segment.
Available Information
We make certain filings with the SEC, including our Annual Report on Form 10-K, quarterly reports on Form 10-Q, current reports on Form 8-K, and all amendments and exhibits to those reports. We make such filings available free of charge through our website, http://www.targaresources.com, as soon as reasonably practicable after they are filed with the SEC. Our press releases and recent analyst presentations are also available on our website. The SEC also maintains an internet website at http://www.sec.gov that contains reports, proxy and information statements and other information regarding issuers, including us, that file electronically with the SEC. The information contained on the websites referenced in this Annual Report on Form 10-K is not incorporated herein by reference.
28
Item 1A. Risk Factors.
The nature of our business activities subjects us to certain hazards and risks. You should consider carefully the following risk factors together with all the other information contained in this report. If any of the following risks were to occur, then our business, financial condition, cash flows and results of operations could be materially adversely affected.
Summary Risk Factors
Risks Related to our Results of Operations
|
|
• |
Our cash flow is affected by supply and demand for natural gas, NGL products and crude oil and by natural gas, NGL, crude oil and condensate prices, and decreases in commodity prices and/or activity levels could adversely affect our results of operations and financial condition. |
|
|
• |
The widespread outbreak of pandemics (like COVID-19) or any other public health crisis that impacts the global demand for energy commodities may have material adverse effects on our business, financial position, results of operations and/or cash flows. |
|
|
• |
A reduction in demand for NGL products by the petrochemical, refinery or other industries or by the fuel or export markets, or a significant increase in NGL product supply relative to this demand, could materially adversely affect our business, results of operations and financial condition. |
|
|
• |
The natural decline in production in our operating regions and in other regions from which we source NGL supplies means our long-term success depends on our ability to obtain new sources of supplies of natural gas, NGLs and crude oil, which depends on certain factors beyond our control. Any decrease in supplies of natural gas, NGLs or crude oil could adversely affect our business and operating results. |
|
|
• |
Our industry is highly competitive and increased competitive pressure could adversely affect our business and operating results. |
|
|
• |
We operate in areas of high industry activity, which may affect our ability to hire, train or retain qualified personnel needed to manage and operate our business. |
|
|
• |
If third-party pipelines and other facilities interconnected to our natural gas and crude oil gathering systems, terminals and processing facilities become partially or fully unavailable to transport natural gas, NGLs and crude oil, our revenues could be adversely affected. |
|
|
• |
We typically do not obtain independent evaluations of natural gas or crude oil reserves dedicated to our gathering pipeline systems; therefore, volumes on our systems in the future could be less than we anticipate. |
|
|
• |
We do not own most of the land on which our pipelines, terminals and compression facilities are located, which could disrupt our operations. |
|
|
• |
If our general partner loses any of its named executive officers, our business may be adversely affected. |
|
|
• |
Weather may limit our ability to operate our business and could adversely affect our operating results. |
|
|
• |
Rising sea levels, subsidence and erosion could damage our pipelines and the facilities that serve our customers, particularly along the Gulf Coast and offshore, which could adversely affect our business, results of operations and financial condition. |
|
|
• |
Our business involves many hazards and operational risks, some of which may not be insured or fully covered by insurance. If a significant accident or event occurs for which we are not fully insured, if we fail to recover all anticipated insurance proceeds for significant accidents or events for which we are insured, or if we fail to rebuild facilities damaged by such accidents or events, our operations and financial results could be adversely affected. |
|
|
• |
Unexpected volume changes due to production variability or to gathering, plant or pipeline system disruptions may increase our exposure to commodity price movements. |
|
|
• |
Portions of our pipeline systems may require increased expenditures for maintenance and repair owing to the age of some of our systems, which expenditures or resulting loss of revenue due to pipeline age or condition could have a material adverse effect on our business and results of operations. |
|
|
• |
Terrorist attacks and the threat of terrorist attacks have resulted in increased costs to our business. Continued hostilities in the Middle East, other sustained military campaigns and civil unrest in the United States may adversely impact our results of operations. |
|
|
• |
We face opposition to operation and expansion of our pipelines and facilities from various individuals and groups. |
|
|
• |
We may incur significant costs and liabilities resulting from performance of pipeline integrity programs and related repairs. |
Risks Related to our Capital Projects and Future Growth
|
|
• |
Our expansion or modification of existing assets or the construction of new assets may not result in revenue increases and are subject to regulatory, environmental, political, legal and economic risks, which could adversely affect our results of operations and financial condition. |
|
|
• |
If we do not develop growth projects and/or make acquisitions for expanding existing assets or constructing new assets on economically acceptable terms, or fail to efficiently and effectively integrate developed or acquired assets with our asset base, our future growth will be limited. In addition, any acquisitions we complete are subject to substantial risks that could adversely affect our financial condition and results of operations. In addition, we may not achieve the expected results of any acquisitions and any adverse conditions or developments related to such acquisitions may have a negative impact on our operations and financial condition. |
29
|
|
• |
Our growth and acquisition strategy requires access to new capital. Tightened capital markets or increased competition for investment opportunities could impair our ability to grow through growth projects or acquisitions. |
|
|
• |
We may be unable to cause our majority-owned joint ventures to take or not to take certain actions unless some or all of our joint venture participants agree and certain of our joint venture partners may fail or refuse to fund their respective portions of capital projects that we believe are necessary to expand or maintain such joint venture’s business. |
Risks Related to our Financial Condition
|
|
• |
If we fail to maintain an effective system of internal controls, we may not be able to accurately report our financial results or prevent fraud. In addition, potential changes in accounting standards might cause us to revise our financial results and disclosure in the future. |
|
|
• |
We are exposed to credit risks of our customers, and any material nonpayment or nonperformance by our key customers could adversely affect our cash flow and results of operations. |
|
|
• |
Changes in future business conditions could have a negative impact on the demand for our services and could cause recorded long-lived assets to become further impaired, and our financial condition and results of operations could suffer if there is a negative impact on the demand for our services and an additional impairment of long-lived assets. |
|
|
• |
Our hedging activities may not be effective in reducing the variability of our cash flows and may, in certain circumstances, increase the variability of our cash flows. Moreover, our hedges may not fully protect us against volatility in basis differentials. Finally, the percentage of our expected equity commodity volumes that are hedged decreases substantially over time. |
|
|
• |
If we fail to balance our purchases and sales of the commodities we handle, our exposure to commodity price risk will increase. |
Risks Related to our Indebtedness
|
|
• |
Increases in interest rates could adversely affect our business. |
|
|
• |
We have a substantial amount of indebtedness which may adversely affect our financial position and we may still be able to incur substantially more debt, which could collectively increase the risks associated with compliance with our financial covenants. |
|
|
• |
The terms of our debt agreements may restrict our current and future operations, particularly our ability to respond to changes in business or to take certain actions. |
|
|
• |
The credit and business risk profile of our general partner could adversely affect our credit ratings and profile. |
Risks Related to Regulatory Matters
|
|
• |
Our and our customers’ operations are subject to a number of risks arising out of the threat of climate change (including legislation or regulation to address climate change) that could result in increased operating costs, limit the areas in which oil and natural gas production may occur, and reduce demand for the products and services we provide. |
|
|
• |
Increasing attention to environmental, social and governance (ESG) matters may impact our business. |
|
|
• |
We could incur significant costs in complying with more stringent occupational safety and health requirements. |
|
|
• |
Laws and regulations regarding hydraulic fracturing could result in restrictions, delays or cancellations in drilling and completing new oil and natural gas wells by our customers, which could adversely impact our revenues by decreasing the volumes of natural gas, NGLs or crude oil through our facilities and reducing the utilization of our assets. |
|
|
• |
Our operations are subject to environmental laws and regulations and a failure to comply or an accidental release into the environment may cause us to incur significant costs and liabilities. |
|
|
• |
A change in the jurisdictional characterization of some of our assets by federal, state, tribal or local regulatory agencies or a change in policy by those agencies may result in increased regulation of our assets, which may cause our revenues to decline and operating expenses to increase or delay or increase the cost of expansion projects. |
|
|
• |
Federal and state legislative and regulatory initiatives relating to pipeline safety that require the use of new or more stringent safety controls or result in more rigorous enforcement of applicable legal requirements could subject us to increased capital costs, operational delays and costs of operation. |
|
|
• |
Should we fail to comply with all applicable FERC-administered statutes, rules, regulations and orders, we could be subject to substantial penalties and fines. |
30
Risks Related to our Results of Operations
Our cash flow is affected by supply and demand for natural gas, NGL products and crude oil and by natural gas, NGL, crude oil and condensate prices, and decreases in commodity prices and/or activity levels could adversely affect our results of operations and financial condition.
Our operations can be affected by the level of natural gas, NGL and crude oil prices and the relationship between these prices. The prices of natural gas, NGLs and crude oil have been volatile, and we expect this volatility to continue. Our future cash flows may be materially adversely affected if we experience significant, prolonged price deterioration. The markets and prices for natural gas, NGLs and crude oil depend upon factors beyond our control. These factors include supply and demand for these commodities, which fluctuates with changes in market and economic conditions, and other factors, including:
|
|
• |
the impact of seasonality and weather; |
|
|
• |
general economic conditions and economic conditions impacting our primary markets; |
|
|
• |
the economic conditions of our customers; |
|
|
• |
the level of domestic crude oil and natural gas production and consumption; |
|
|
• |
the availability of imported natural gas, liquefied natural gas, NGLs and crude oil; |
|
|
• |
actions taken by major foreign oil and gas producing nations; |
|
|
• |
the availability of local, intrastate and interstate transportation systems and storage for residue natural gas and NGLs; |
|
|
• |
the availability of domestic storage for crude oil; |
|
|
• |
the availability and marketing of competitive fuels and/or feedstocks; |
|
|
• |
the impact of energy conservation efforts; |
|
|
• |
stockholder activism and activities by non-governmental organizations to limit certain sources of funding for the energy sector or restrict the exploration, development and production of crude oil and natural gas; and |
|
|
• |
the extent and nature of governmental regulation and taxation, including those related to the prorationing of oil and gas production. |
Additionally, we have been and may continue to be adversely affected by the continued impact on global demand for energy commodities related to the COVID-19 pandemic. The COVID-19 pandemic has reduced economic activity and the related demand for energy commodities. These effects, combined with a period of increased production from major oil producing nations and decreasing availability of crude oil storage, have contributed to lower commodity prices compared to historical levels and are expected to continue to impact demand over the short-to-medium-term.
Our primary natural gas gathering and processing arrangements that expose us to commodity price risk are our percent-of-proceeds arrangements. Under these arrangements, we generally process natural gas from producers and remit to the producers an agreed percentage of the proceeds from the sale of residue gas and NGL products at market prices or a percentage of residue gas and NGL products at the tailgate of our processing facilities. In some percent-of-proceeds arrangements, we remit to the producer a percentage of an index-based price for residue gas and NGL products, less agreed adjustments, rather than remitting a portion of the actual sales proceeds. Under these types of arrangements, our revenues and cash flows increase or decrease, whichever is applicable, as the prices of natural gas, NGLs and crude oil fluctuate, to the extent our exposure to these prices is unhedged. See “Item 7A. Quantitative and Qualitative Disclosures About Market Risk.”
31
The widespread outbreak pandemics (like COVID-19) or any other public health crisis that impacts the global demand for energy commodities may have material adverse effects on our business, financial position, results of operations and/or cash flows.
We face risks related to the outbreak of illnesses, pandemics and other public health crises that are outside of our control and could significantly disrupt our operations and adversely affect our financial condition. For example, the global spread of COVID-19 has caused business disruption, including disruption to the oil and gas industry. The COVID-19 pandemic has negatively impacted the global economy, disrupted global supply chains, reduced global demand for oil and gas, and created significant volatility and disruption of financial and commodity markets. The full extent of the impact of the COVID-19 pandemic on our operational and financial performance, including our ability to execute our business strategies and initiatives in the expected time frame, is uncertain and depends on various factors, including the demand for natural gas, NGLs and crude oil (including the impact that reductions in travel, manufacturing and consumer product demand have had and will have on the demand for energy commodities), the availability of personnel, equipment and services critical to our ability to operate our assets and the impact of potential governmental restrictions on travel, transportation and operations.
The degree to which the COVID-19 pandemic or any other public health crisis adversely impacts our results will also depend on future developments, which are highly uncertain and cannot be predicted. These developments include, but are not limited to, the duration and spread of the outbreak, its severity, the actions to contain the virus or treat its impact, its impact on the economy and market conditions, and how quickly and to what extent normal economic and operating conditions can resume. Therefore, while we expect this matter will continue to disrupt our operations in some way, the degree of the adverse financial impact cannot be reasonably estimated at this time.
Refer to Note 5 - Property, Plant and Equipment and Intangible Assets of the “Consolidated Financial Statements” included in this Annual Report for further discussion regarding the impact of COVID-19 and non-cash pre-tax impairments recorded by the Company in 2020.
A reduction in demand for NGL products by the petrochemical, refinery or other industries or by the fuel or export markets, or a significant increase in NGL product supply relative to this demand, could materially adversely affect our business, results of operations and financial condition.
The NGL products we produce have a variety of applications, including heating fuels, petrochemical feedstocks and refining blend stocks. A reduction in demand for NGL products, whether because of general or industry-specific economic conditions, new government regulations, global competition, reduced demand by consumers for products made with NGL products (for example, reduced petrochemical demand observed due to lower activity in the automobile and construction industries), reduced demand for propane or butane exports whether for price or other reasons, reduced demand due to the effects of the COVID-19 pandemic, increased competition from petroleum-based feedstocks due to pricing differences, mild winter weather for some NGL applications or other reasons, could result in a decline in the volume of NGL products we handle or reduce the fees we charge for our services. Also, increased supply of NGL products could reduce the value of NGLs handled by us and reduce the margins realized. Our NGL products and their demand are affected as follows:
Ethane. Ethane is typically supplied as purity ethane and as part of an ethane-propane mix. Ethane is primarily used in the petrochemical industry as feedstock for ethylene, one of the basic building blocks for a wide range of plastics and other chemical products. Although ethane is typically extracted as part of the mixed NGL stream at gas processing plants, if natural gas prices increase significantly in relation to NGL product prices or if the demand for ethylene falls, it may be more profitable for natural gas processors to leave the ethane in the natural gas stream, thereby reducing the volume of NGLs delivered for fractionation and marketing.
Propane. Propane is used as a petrochemical feedstock in the production of ethylene and propylene, as a heating, engine and industrial fuel, and in agricultural applications such as crop drying. Changes in demand for ethylene and propylene could adversely affect demand for propane. The demand for propane as a heating fuel is significantly affected by weather conditions. The volume of propane sold is increasingly driven by international exports supplying a growing global demand for the product. Domestically in the U.S., propane is at its highest during the six-month peak heating season of October through March. Demand for our propane may be reduced during periods of slow global economic growth and warmer-than-normal weather.
Normal Butane. Normal butane is used in the production of isobutane, as a refined petroleum product blending component, as a fuel gas (either alone or in a mixture with propane) and in the production of ethylene and propylene. Changes in the composition of refined petroleum products resulting from governmental regulation, changes in feedstocks, products and economics, and demand for heating fuel, ethylene and propylene could adversely affect demand for normal butane. The volume of butane sold is increasingly driven by international exports supplying a growing demand for the product.
32
Isobutane. Isobutane is predominantly used in refineries to produce alkylates to enhance octane levels. Accordingly, any action that reduces demand for motor gasoline or demand for isobutane to produce alkylates for octane enhancement might reduce demand for isobutane.
Natural Gasoline. Natural gasoline is used as a blending component for certain refined petroleum products and as a feedstock used in the production of ethylene and propylene. Changes in the mandated composition of motor gasoline resulting from governmental regulation, and in demand for ethylene and propylene, could adversely affect demand for natural gasoline.
NGLs and products produced from NGLs also compete with products from global markets. Any reduced demand or increased supply for ethane, propane, normal butane, isobutane or natural gasoline in the markets we access for any of the reasons stated above could adversely affect both demand for the services we provide and NGL prices, which could negatively impact our results of operations and financial condition.
The natural decline in production in our operating regions and in other regions from which we source NGL supplies means our long-term success depends on our ability to obtain new sources of supplies of natural gas, NGLs and crude oil, which depends on certain factors beyond our control. Any decrease in supplies of natural gas, NGLs or crude oil could adversely affect our business and operating results.
Our gathering systems are connected to crude oil and natural gas wells from which production will naturally decline over time, which means that the cash flows associated with these sources of natural gas and crude oil will likely also decline over time. Our logistics assets are similarly impacted by declines in NGL supplies in the regions in which we operate as well as other regions from which we source NGLs. To maintain or increase throughput levels on our gathering systems and the utilization rate at our processing plants and our treating and fractionation facilities, we must continually obtain new natural gas, NGL and crude oil supplies. A material decrease in natural gas or crude oil production from producing areas on which we rely, as a result of depressed commodity prices or otherwise, could result in a decline in the volume of natural gas or crude oil that we gather and process, NGLs that we transport or NGL products delivered to our fractionation facilities. Our ability to obtain additional sources of natural gas, NGLs and crude oil depends, in part, on the level of successful drilling and production activity near our gathering systems and, in part, on the level of successful drilling and production in other areas from which we source NGL and crude oil supplies. We have no control over the level of such activity in the areas of our operations, the amount of reserves associated with the wells or the rate at which production from a well will decline. In addition, we have no control over producers or their drilling, completion or production decisions, which are affected by, among other things, prevailing and projected energy prices, demand for hydrocarbons, the level of reserves, geological considerations, governmental regulations, the availability of drilling rigs, other production and development costs and the availability and cost of capital.
Fluctuations in energy prices can greatly affect production rates and investments by third parties in the development of new oil and natural gas reserves. Drilling and production activity generally decreases as crude oil and natural gas prices decrease. Prices of crude oil and natural gas have been historically volatile, and we expect this volatility to continue. Consequently, even if new natural gas or crude oil reserves are discovered in areas served by our assets, producers may choose not to develop those reserves. For example, current low prices for natural gas combined with relatively high levels of natural gas in storage could result in curtailment or shut-in of natural gas production similar to the production shut-ins we experienced in 2020 due to the impacts of the COVID-19 pandemic. Furthermore, in response to depressed commodity prices, many operators have announced substantial reductions in their estimated capital expenditures, rig count and completion crews. Reductions in exploration and production activity, competitor actions or shut-ins by producers in the areas in which we operate may prevent us from obtaining supplies of natural gas or crude oil to replace the natural decline in volumes from existing wells, which could result in reduced volumes through our facilities and reduced utilization of our gathering, treating, processing, transportation and fractionation assets.
Our industry is highly competitive and increased competitive pressure could adversely affect our business and operating results.
We compete with similar enterprises in our respective areas of operation. Some of our competitors are large crude oil, natural gas and NGL companies that have greater financial resources and access to supplies of natural gas, NGLs and crude oil than we do. Some of these competitors may expand or construct gathering, processing, storage, terminaling and transportation systems that would create additional competition for the services we provide to our customers. In addition, customers who are significant producers of natural gas may develop their own gathering, processing, storage, terminaling and transportation systems in lieu of using those operated by us. Our ability to renew or replace existing contracts with our customers at rates sufficient to maintain current revenues and cash flows could be adversely affected by the activities of our competitors and our customers. All of these competitive pressures could have a material adverse effect on our business, results of operations and financial condition.
33
We operate in areas of high industry activity, which may affect our ability to hire, train or retain qualified personnel needed to manage and operate our business.
We operate in areas in which industry activity has increased rapidly. As a result, demand for qualified personnel in these areas, particularly those related to our Permian and Badlands assets, and the cost to attract and retain such personnel, has increased over the past few years due to competition, and may increase substantially in the future. Moreover, our competitors may be able to offer better compensation packages to attract and retain qualified personnel than we are able to offer.
Any delay or inability to secure the personnel necessary for us to continue or complete our current and planned development projects, or any significant increases in costs with respect to the hiring, training or retention of qualified personnel, could have a material adverse effect on our business, financial condition and results of operations.
If third-party pipelines and other facilities interconnected to our natural gas and crude oil gathering systems, terminals and processing facilities become partially or fully unavailable to transport natural gas, NGLs and crude oil, our revenues could be adversely affected.
We depend upon third-party pipelines, storage and other facilities that provide delivery options to and from our gathering and processing facilities. Since we do not own or operate these pipelines or other facilities, their continuing operation in their current manner is not within our control. If any of these third-party facilities become partially or fully unavailable, or if the quality specifications for their facilities change so as to restrict our ability to utilize them, our revenues could be adversely affected.
We typically do not obtain independent evaluations of natural gas or crude oil reserves dedicated to our gathering pipeline systems; therefore, volumes on our systems in the future could be less than we anticipate.
We typically do not obtain independent evaluations of natural gas or crude oil reserves connected to our gathering systems due to the unwillingness of producers to provide reserve information as well as the cost of such evaluations. Accordingly, we do not have independent estimates of total reserves dedicated to our gathering systems or the anticipated life of such reserves. If the total reserves or estimated life of the reserves connected to our gathering systems is less than we anticipate and we are unable to secure additional sources of supply, then the volumes of natural gas or crude oil transported on our gathering systems in the future could be less than we anticipate. A decline in the volumes on our systems could have a material adverse effect on our business, results of operations and financial condition.
We do not own most of the land on which our pipelines, terminals and compression facilities are located, which could disrupt our operations.
We do not own most of the land on which our pipelines, terminals and compression facilities are located, and we are therefore subject to the possibility of more onerous terms and/or increased costs to retain necessary land use if we do not have valid rights of way or leases or if such rights of way or leases lapse or terminate. We sometimes obtain the rights to land owned by third parties and governmental agencies for a specific period of time. Additionally, the federal Tenth Circuit Court of Appeals has held that tribal ownership of even a very small fractional interest in an allotted land, that is, tribal land owned or at one time owned by an individual Indian landowner, bars condemnation of any interest in the allotment. Consequently, the inability to condemn such allotted lands under circumstances where an existing pipeline rights of way may soon lapse or terminate serves as an additional impediment for pipeline operators. We cannot guarantee that we will always be able to renew existing rights of way or obtain new rights of way without experiencing significant costs. Any loss of rights with respect to our real property, through our inability to renew rights of way contracts or leases, or otherwise, could cause us to cease operations on the affected land, increase costs related to continuing operations elsewhere and reduce our revenue.
If our general partner loses any of its named executive officers, our business may be adversely affected.
Our success is dependent upon the efforts of the named executive officers of our general partner. The named executive officers of our general partner are responsible for executing our business strategies. There is substantial competition for qualified personnel in the midstream oil and gas industry. Our general partner may not be able to retain its existing named executive officers or fill new positions or vacancies created by expansion or turnover. Our general partner has not entered into employment agreements with any of its named executive officers. In addition, our general partner does not maintain “key man” life insurance on the lives of any of its named executive officers. A loss of one or more of the named executive officers of our general partner could harm our business and prevent us from implementing our business strategies.
34
Weather may limit our ability to operate our business and could adversely affect our operating results.
The weather in the areas in which we operate can cause disruptions and in some cases suspension of our operations and development activities. For example, unseasonably wet weather, extended periods of below freezing weather, or hurricanes may cause a loss of throughput from temporary cessation of activities or lost or damaged equipment. Our planning for normal climatic variation, insurance programs and emergency recovery plans may inadequately mitigate the effects of such weather conditions, and not all such effects can be predicted, eliminated or insured against. Some forecasters expect that potential climate changes may have significant physical effects, such as increased frequency and severity of storms, floods and other climatic events and could have a material adverse effect on our operations. Any unusual or prolonged severe weather or increased frequency thereof, such as freezing rain, earthquakes, hurricanes, droughts, or floods in our or our oil and gas exploration and production customers’ areas of operations or markets, whether due to climate change or otherwise, could have a material adverse effect on our business, results of operations and financial condition.
Rising sea levels, subsidence and erosion could damage our pipelines and the facilities that serve our customers, particularly along the Gulf Coast and offshore, which could adversely affect our business, results of operations and financial condition.
Our operations along the Gulf Coast and offshore could be impacted by rising sea levels, subsidence and erosion. Subsidence issues are also a concern for our pipelines at major river crossings. Rising sea levels, subsidence and erosion could cause serious damage to our pipelines and other facilities, which could affect our ability to provide services or result in leakage, migration, releases or spills from our operations to surface or subsurface soils, surface water, groundwater or to the Gulf of Mexico, which could result in liability, remedial obligations and/or otherwise have a negative impact on continued operations. Additionally, such rising sea levels, subsidence and erosion processes could impact our oil and gas exploration and production customers who operate along the Gulf Coast, and they may be unable to utilize our services. Rising sea levels, subsidence and erosion could also expose our operations to increased risks associated with severe weather conditions and other adverse events and conditions, such as hurricanes and flooding. As a result, we may incur costs to repair and preserve our pipeline infrastructure and other facilities. Such costs could adversely affect our business, financial condition, results of operations and cash flows. In addition, local governments and landowners have filed lawsuits in recent years in Louisiana against energy companies, alleging that their operations contributed to increased coastal rising seas and erosion and seeking substantial damages.
Our business involves many hazards and operational risks, some of which may not be insured or fully covered by insurance. If a significant accident or event occurs for which we are not fully insured, if we fail to recover all anticipated insurance proceeds for significant accidents or events for which we are insured, or if we fail to rebuild facilities damaged by such accidents or events, our operations and financial results could be adversely affected.
Our operations are subject to many hazards inherent in purchasing, gathering, compressing, treating, processing and/or selling natural gas; storing, fractionating, treating, transporting and selling NGLs and NGL products; and purchasing, gathering, storing and/or terminaling crude oil, including:
|
|
• |
damage to pipelines and plants, related equipment and surrounding properties caused by hurricanes, tornadoes, floods, fires and other natural disasters, explosions and acts of terrorism; |
|
|
• |
inadvertent damage from third parties, including from motor vehicles and construction, farm or utility equipment; |
|
|
• |
damage that is the result of our negligence or any of our employees’ negligence; |
|
|
• |
leaks of natural gas, NGLs, crude oil and other hydrocarbons or losses of natural gas or NGLs as a result of the malfunction of equipment or facilities; |
|
|
• |
spills or other unauthorized releases of natural gas, NGLs, crude oil, other hydrocarbons or waste materials that contaminate the environment, including soils, surface water and groundwater, and otherwise adversely impact natural resources; and |
|
|
• |
other hazards that could also result in personal injury, loss of life, pollution and/or suspension of operations. |
35
These risks could result in substantial losses due to personal injury, loss of life, severe damage to and destruction of property and equipment, and pollution or other environmental or natural resource damage, and may result in delay, curtailment or suspension of our related operations. A natural disaster or other hazard affecting the areas in which we operate could have a material adverse effect on our operations. We are not fully insured against all risks inherent to our business. Additionally, while we are insured for pollution resulting from environmental accidents that occur on a sudden and accidental basis, we may not be insured against all environmental accidents that might occur, some of which may result in toxic tort claims. If a significant accident or event occurs that is not fully insured, if we fail to recover all anticipated insurance proceeds for significant accidents or events for which we are insured, or if we fail to rebuild facilities damaged by such accidents or events, our operations and financial condition could be adversely affected. In addition, we may not be able to maintain or obtain insurance of the type and amount we desire at reasonable rates. As a result of market conditions, premiums and deductibles for certain of our insurance policies have increased substantially, and could escalate further. For example, following the occurrence of severe hurricanes along the U.S. Gulf Coast in recent years, insurance premiums, deductibles and co-insurance requirements increased substantially, and terms were generally less favorable than terms that could be obtained prior to such hurricanes, with some coverage unavailable at any cost.
Unexpected volume changes due to production variability or to gathering, plant or pipeline system disruptions may increase our exposure to commodity price movements.
We sell processed natural gas at plant tailgates or at pipeline pooling points. Sales made to natural gas marketers and end-users may be interrupted by disruptions to volumes anywhere along the system. We attempt to balance sales with volumes supplied from processing operations, but unexpected volume variations due to production variability or to gathering, plant or pipeline system disruptions may expose us to volume imbalances which, in conjunction with movements in commodity prices, could materially impact our income from operations and cash flow.
Portions of our pipeline systems may require increased expenditures for maintenance and repair owing to the age of some of our systems, which expenditures or resulting loss of revenue due to pipeline age or condition could have a material adverse effect on our business and results of operations.
Some portions of the pipeline systems that we operate have been in service for several decades prior to our purchase of them. Consequently, there may be historical occurrences or latent issues regarding our pipeline systems that our executive management may be unaware of and that may have a material adverse effect on our business and results of operations. The age and condition of some of our pipeline systems could also result in increased maintenance or repair expenditures, and any downtime associated with increased maintenance and repair activities could materially reduce our revenue. Any significant increase in maintenance and repair expenditures or loss of revenue due to the age or condition of some portions of our pipeline systems could adversely affect our business and results of operations.
Terrorist attacks and the threat of terrorist attacks have resulted in increased costs to our business. Continued hostilities in the Middle East, other sustained military campaigns and civil unrest in the United States may adversely impact our results of operations.
The long-term impact of terrorist attacks, such as the attacks that occurred on September 11, 2001, and the threat of future terrorist attacks on our industry in general and on us in particular is not known at this time. However, resulting regulatory requirements and/or related business decisions associated with security are likely to increase our costs. Increased security measures taken by us as a precaution against possible terrorist attacks have resulted in increased costs to our business. Uncertainty surrounding continued hostilities in the Middle East or other sustained military campaigns may affect our operations in unpredictable ways, including disruptions of crude oil supplies and markets for our products, and the possibility that infrastructure facilities could be direct targets, or indirect casualties, of an act of terror. Additionally, recent acts of protest and civil unrest have caused economic and political disruption in the United States.
Changes in the insurance markets attributable to terrorist attacks may make certain types of insurance more difficult for us to obtain. Moreover, the insurance that may be available to us may be significantly more expensive than our existing insurance coverage or coverage may be reduced or unavailable. Instability in the financial markets as a result of terrorism or war could also affect our ability to raise capital.
36
We face opposition to operation and expansion of our pipelines and facilities from various individuals and groups.
We have experienced, and we anticipate that we will encounter from time to time, opposition to the operation and expansion of our pipelines and facilities from governmental officials, non-governmental environmental organizations and groups, landowners, tribal groups, local groups and other advocates. In some instances, we encounter opposition which disfavors hydrocarbon-based energy supplies regardless of practical implementation or financial considerations. Opposition to our operation and expansion can take many forms, including the delay, denial or termination of required governmental permits or approvals, organized protests, attempts to block or sabotage our operations, intervention in regulatory or administrative proceedings involving our assets or lawsuits or other actions designed to prevent, disrupt, delay or terminate the operation or expansion of our assets and business. In addition, destructive forms of protest or opposition by activists, including acts of sabotage or eco terrorism could cause significant damage or injury to people, property or the environment or lead to extended interruptions of our operations. Any such event that restricts, delays or prevents the expansion of our business, interrupts the revenues generated by our operations or causes us to make significant expenditures not covered by insurance could adversely affect our business, results of operations, and financial condition.
We may incur significant costs and liabilities resulting from performance of pipeline integrity programs and related repairs.
Pursuant to the authority under the NGPSA and HLPSA, PHMSA has established a series of rules requiring pipeline operators to develop and implement integrity management programs for certain natural gas and hazardous liquids pipelines that, in the event of a pipeline leak or rupture could affect higher risk areas, known as HCAs and MCAs, which are areas where a release could have the most significant adverse consequences. The HCAs for natural gas, crude oil, NGL and condensate pipelines impose increasing safety-related requirements as the population density or ecological sensitivity increases. An MCA is defined in relation to natural gas pipelines and is based on high-population areas as well as certain principal, high-capacity roadways, though it does not meet the definition of a natural gas pipeline HCA. Among other things, these regulations require operators of covered pipelines to:
|
|
• |
perform ongoing assessments of pipeline integrity; |
|
|
• |
identify and characterize applicable threats to pipeline segments that could impact an HCA or MCA; |
|
|
• |
maintain processes for data collection, integration and analysis; |
|
|
• |
repair and remediate pipelines as necessary; and |
|
|
• |
implement preventive and mitigating actions. |
In addition, certain states, including Texas, Louisiana, Oklahoma, New Mexico, and North Dakota, where we conduct operations, have adopted regulations similar to existing PHMSA regulations for certain intrastate natural gas and hazardous liquids pipelines. We currently estimate an average annual cost of $4.9 million between 2021 and 2023 to implement pipeline integrity management program testing along certain segments of our natural gas and hazardous liquids pipelines. This estimate does not include the costs, if any, of repair, remediation or preventative or mitigative actions that may be determined to be necessary as a result of the discovery of anomaly conditions during the testing program, which costs could be substantial. At this time, we cannot predict the ultimate cost of compliance with applicable pipeline integrity management regulations, as the cost will vary significantly depending on the number and extent of any repairs found to be necessary as a result of the pipeline integrity testing. We plan to continue our pipeline integrity testing programs to assess and maintain the integrity of our pipelines. The results of these tests could cause us to incur significant and unanticipated capital and operating expenditures for repairs or upgrades deemed necessary to ensure the continued safe and reliable operation of our pipelines.
37
Moreover, changes to pipeline safety laws by Congress and regulations by PHMSA that result in more stringent or costly safety standards could have a material adverse effect on us and similarly situated midstream operators. For instance, several years after publishing a proposed rulemaking, referred to as the “gas Mega Rule,” that proposed to expand various technical and operating aspects of gas pipelines, PHMSA elected to split the proposed rulemaking into three rules. The first of these rules, relating to onshore gas transmission pipelines, was published as a final rule in October 2019 and became effective in July 2020. This final rule required, among other things, reconfirmation of maximum allowable operating pressure (“MAOP”) and assessment of additional pipeline mileage outside of HCAs (including all MCAs and those Class 3 and Class 4 areas found not to be in HCAs) within 14 years of the publication date and at least once every 10 years thereafter. The remaining rulemakings comprising the gas Mega Rule have not yet been published, and we cannot predict when they will be finalized; however, they are expected to include revised pipeline repair criteria as well as more stringent corrosion control requirements. Additionally, PHMSA published a final rule in October 2019 for hazardous liquid transmission and gathering pipelines. This hazardous liquid final rule became effective in July 2020 and significantly extends and expands the reach of certain PHMSA integrity management requirements, regardless of the pipeline’s proximity to an HCA and requires most hazardous liquid pipelines in or affecting an HCA to be capable of accommodating in-line inspection tools within the next 20 years. In April 2020 and June 2020, PHMSA published proposed rules that would seek to ease regulatory burdens on hazardous liquid pipelines and gas transmission, distribution and gathering lines. No final rules have been issued with respect to those proposed rulemakings and it is expected that President Biden will reconsider those rules.
Integrity-related requirements and other provisions required under applicable pipeline safety laws together with any implementation of PHMSA rules thereunder, could require us to pursue additional capital projects or conduct integrity or maintenance programs on an accelerated basis and incur increased operating costs that could have a material adverse effect on our costs of transportation services as well as our business, results of operations and financial condition.
We are subject to cyber security risks. A cyber incident could occur and result in information theft, data corruption, operational disruption and/or financial loss.
The oil and natural gas industry has become increasingly dependent on digital technologies to conduct business. For example, we depend on digital technologies to operate our facilities, serve our customers and record financial data. At the same time, cyber incidents, including deliberate attacks, have increased. The U.S. government has issued public warnings that indicate that energy assets might be specific targets of cyber security threats. Our technologies, systems and networks, and those of our vendors, suppliers, customers and other business partners, may become the target of cyberattacks or information security breaches that could result in the unauthorized release, gathering, monitoring, misuse, loss or destruction of proprietary and other information, or could adversely disrupt our business operations. In addition, certain cyber incidents, such as surveillance, may remain undetected for an extended period. Our systems for protecting against cyber security risks may not be sufficient. As cyber incidents continue to evolve, we will likely be required to expend additional resources to enhance our security posture and cybersecurity defenses or to investigate and remediate any vulnerability to or consequences of cyber incidents. Our insurance coverages for cyberattacks may not be sufficient to cover all the losses we may experience as a result of a cyber incident.
38
Risks Related to our Capital Projects and Future Growth
Our expansion or modification of existing assets or the construction of new assets may not result in revenue increases and are subject to regulatory, environmental, political, legal and economic risks, which could adversely affect our results of operations and financial condition.
The construction of additions or modifications to our existing systems and the construction of new midstream assets involve numerous regulatory, environmental, political and legal uncertainties beyond our control and may require the expenditure of significant amounts of capital. If we undertake these projects, they may not be completed on schedule, at the budgeted cost or at all. For example, the construction of additional systems may be delayed or require greater capital investment if the commodity prices of certain supplies, such as steel pipe, increase due to imposed tariffs. Moreover, our revenues may not increase immediately upon the expenditure of funds on a particular project. For instance, if we build a new pipeline, fractionation facility or gas processing plant, the construction may occur over an extended period of time and we will not receive any material increases in revenues until the project is completed. Moreover, we may construct pipelines or facilities to capture anticipated future growth in production in a region in which such growth does not materialize. Since we are not engaged in the exploration for and development of natural gas and oil reserves, we do not possess reserve expertise and we often do not have access to third-party estimates of potential reserves in an area prior to constructing pipelines or facilities in such area. To the extent we rely on estimates of future production in any decision to construct additions to our systems, such estimates may prove to be inaccurate because there are numerous uncertainties inherent in estimating quantities of future production. As a result, new pipelines or facilities may not be able to attract enough throughput to achieve our expected investment return, which could adversely affect our results of operations and financial condition. In addition, the construction of additions to our existing gathering and transportation assets may require us to obtain new rights of way prior to constructing new pipelines. We may be unable to obtain or renew such rights of way to connect new natural gas and crude oil supplies to our existing gathering lines or capitalize on other attractive expansion opportunities. Additionally, it may become more expensive for us to obtain new rights of way or to renew existing rights of way. If the cost of renewing or obtaining new rights of way increases, our cash flows could be adversely affected.
If we do not develop growth projects and/or make acquisitions for expanding existing assets or constructing new assets on economically acceptable terms, or fail to efficiently and effectively integrate developed or acquired assets with our asset base, our future growth will be limited. In addition, any acquisitions we complete are subject to substantial risks that could adversely affect our financial condition and results of operations. In addition, we may not achieve the expected results of any acquisitions and any adverse conditions or developments related to such acquisitions may have a negative impact on our operations and financial condition.
Our ability to grow depends, in part, on our ability to develop growth projects and/or make acquisitions that result in an increase in cash generated from operations. We will need to focus on organic growth and third-party acquisitions. If we are unable to develop accretive growth projects or make accretive acquisitions because we are (1) unable to develop growth projects economically or identify attractive acquisition candidates and negotiate acceptable acquisition agreements or, (2) unable to obtain financing for these projects or acquisitions on economically acceptable terms, or (3) unable to compete successfully for growth projects or acquisitions, then our future growth will be limited.
Any growth project or acquisition involves potential risks, including, among other things:
|
|
• |
operating a significantly larger combined organization and adding new or expanded operations; |
|
|
• |
difficulties in the assimilation of the assets and operations of the growth projects or acquired businesses, especially if the assets developed or acquired are in a new business segment and/or geographic area; |
|
|
• |
the risk that crude oil and natural gas reserves expected to support the acquired assets may not be of the anticipated magnitude or may not be developed as anticipated; |
|
|
• |
the failure to realize expected volumes, revenues, profitability or growth; |
|
|
• |
the failure to realize any expected synergies and cost savings; |
|
|
• |
coordinating geographically disparate organizations, systems and facilities; |
|
|
• |
the assumption of environmental and other unknown liabilities; |
|
|
• |
limitations on rights to indemnity from the seller in an acquisition or the contractors and suppliers in growth projects; |
|
|
• |
the failure to attain or maintain compliance with environmental and other governmental regulations; |
39
|
|
• |
inaccurate assumptions about the overall costs of equity or debt; |
|
|
• |
the diversion of management’s and employees’ attention from other business concerns; |
|
|
• |
challenges associated with joint venture relationships and minority investments, including dependence on joint venture partners, or management who may have business interests, strategies or goals that are inconsistent with ours; and |
|
|
• |
customer or key employee losses at the acquired businesses or to a competitor. |
If these risks materialize, any growth project or acquired assets may inhibit our growth, fail to deliver expected benefits and/or add further unexpected costs. Challenges may arise whenever businesses with different operations or management are combined, and we may experience unanticipated delays in realizing the benefits of a growth project or acquisition. If we consummate any future growth project or acquisition, our capitalization and results of operations may change significantly and you may not have the opportunity to evaluate the economic, financial and other relevant information that we will consider in evaluating future growth projects or acquisitions.
Our growth and acquisition strategy is based, in part, on our expectation of ongoing divestitures of energy assets by industry participants and new opportunities created by industry expansion. A material decrease in such divestitures or in opportunities for economic commercial expansion would limit our opportunities for future growth projects or acquisitions and could adversely affect our operations and cash flows.
Growth projects may increase our concentration in a line of business or geographic region and acquisitions may significantly increase our size and diversify the geographic areas in which we operate. In addition, we may not achieve the desired effect from any future growth projects or acquisitions.
Our growth and acquisition strategy requires access to new capital. Tightened capital markets or increased competition for investment opportunities could impair our ability to grow through growth projects or acquisitions.
We continuously consider and enter into discussions regarding potential growth projects and acquisitions. Any limitations on our access to capital will impair our ability to execute this strategy. If the cost of such capital becomes too expensive, our ability to develop or acquire strategic and accretive assets will be limited. We may not be able to raise the necessary funds on satisfactory terms, if at all. The primary factors that influence our initial cost of equity include market conditions, fees we pay to underwriters and other offering costs, which include amounts we pay for legal and accounting services. The primary factors influencing our cost of borrowing include interest rates, credit spreads, covenants, underwriting or loan origination fees and similar charges we pay to lenders. These factors may impair our ability to execute our growth and acquisition strategy.
In addition, we may experience increased competition for the types of assets we contemplate purchasing or developing. Current economic conditions, including those caused by the effects of the COVID-19 pandemic, and competition for asset purchases and development opportunities could limit our ability to fully execute our growth and acquisition strategy.
We may be unable to cause our majority-owned joint ventures to take or not to take certain actions unless some or all of our joint venture participants agree and certain of our joint venture partners may fail or refuse to fund their respective portions of capital projects that we believe are necessary to expand or maintain such joint venture’s business.
We participate in several majority-owned joint ventures whose corporate governance structures require at least a majority in interest vote to authorize many basic activities and require a greater voting interest (sometimes up to 100%) to authorize more significant activities. Examples of these more significant activities include, among others, large expenditures or contractual commitments, the construction or acquisition of assets, borrowing money or otherwise raising capital, making distributions, transactions with affiliates of a joint venture participant, litigation and transactions not in the ordinary course of business. Without the concurrence of joint venture participants with enough voting interests, we may be unable to cause any of our joint ventures to take or not take certain actions, even though taking or preventing those actions may be in our best interests or the particular joint venture.
Certain of our joint venture partners may fail, refuse or elect not to fund their respective portions of capital projects that we believe are necessary to effectively expand or maintain such joint venture’s business. Such failure or election not to fund may impact the operations of the joint venture and may increase the capital that could be required from us if we were to fund such projects without the full participation of our joint venture partners. We may not achieve an acceptable rate of return for any such additional expenditures.
In addition, subject to certain conditions, any joint venture owner may sell, transfer or otherwise modify its ownership interest in a joint venture, whether in a transaction involving third parties or the other joint owners. Any such transaction could result in our partnering with different or additional parties.
40
We may operate a portion of our business with one or more joint venture partners where we own a minority interest and/or are not the operator, which may restrict our operational and corporate flexibility. Actions taken by the other partner or third-party operator may materially impact our financial position and results of operations, and we may not realize the benefits we expect to realize from a joint venture.
As is common in the midstream industry, we may operate one or more of our properties with one or more joint venture partners where we own a minority interest and/or contract with a third party to control operations. These relationships could require us to share operational and other control, such that we may no longer have the flexibility to control completely the development of these properties. If we do not timely meet our financial commitments in such circumstances, our rights to participate may be adversely affected. If a joint venture partner is unable or fails to pay its portion of development costs or if a third-party operator does not operate in accordance with our expectations, our costs of operations could be increased. We could also incur liability as a result of actions taken by a joint venture partner or third-party operator. Disputes between us and the other party may result in litigation or arbitration that would increase our expenses, delay or terminate projects and distract our officers and directors from focusing their time and effort on our business.
Risks Related to our Financial Condition
If we fail to maintain an effective system of internal controls, we may not be able to accurately report our financial results or prevent fraud. In addition, potential changes in accounting standards might cause us to revise our financial results and disclosure in the future.
Effective internal controls are necessary for us to provide timely and reliable financial reports and effectively prevent fraud. If we cannot provide timely and reliable financial reports or prevent fraud, our reputation and operating results would be harmed. We continue to enhance our internal controls and financial reporting capabilities. These enhancements require a significant commitment of resources, personnel and the development and maintenance of formalized internal reporting procedures to ensure the reliability of our financial reporting. Our efforts to update and maintain our internal controls may not be successful, and we may be unable to maintain adequate controls over our financial processes and reporting now or in the future, including future compliance with the obligations under Section 404 of the Sarbanes-Oxley Act of 2002.
Any failure to maintain effective controls or difficulties encountered in the effective improvement of our internal controls could prevent us from timely and reliably reporting our financial results and may harm our operating results. Ineffective internal controls could also cause investors to lose confidence in our reported financial information. In addition, the Financial Accounting Standards Board or the SEC could enact new accounting standards that might impact how we are required to record revenues, expenses, assets and liabilities. Any significant change in accounting standards or disclosure requirements could have a material effect on our results of operations, financial condition and ability to comply with our debt obligations.
We are exposed to credit risks of our customers, and any material nonpayment or nonperformance by our key customers could adversely affect our cash flow and results of operations.
Many of our customers may experience financial problems that could have a significant effect on their creditworthiness, especially in a depressed commodity price environment. A decline in natural gas, NGL and crude oil prices may adversely affect the business, financial condition, results of operations, creditworthiness, cash flows and prospects of some of our customers. Severe financial problems encountered by our customers could limit our ability to collect amounts owed to us, or to enforce performance of obligations under contractual arrangements. In addition, many of our customers finance their activities through cash flow from operations, the incurrence of debt or the issuance of equity. The combination of reduction of cash flow resulting from a decline in commodity prices, a reduction in borrowing bases under reserve-based credit facilities and the lack of availability of debt or equity financing may result in a significant reduction of our customers’ liquidity and limit their ability to make payment or perform on their obligations to us. Additionally, a decline in the share price of some of our public customers may place them in danger of becoming delisted from a public securities exchange, limiting their access to the public capital markets and further restricting their liquidity. Furthermore, some of our customers may be highly leveraged and subject to their own operating and regulatory risks, which increases the risk that they may default on their obligations to us. To the extent one or more of our key customers is in financial distress or commences bankruptcy proceedings, contracts with these customers may be subject to renegotiation or rejection under applicable provisions of the United States Bankruptcy Code. Furthermore, some bankruptcy courts have found that, in certain cases oil, gas and water gathering agreements do not create covenants running with the land under governing law and are thus subject to rejection in chapter 11 proceedings. Whether a particular contract is subject to rejection depends on the wording of the contract, the governing law and the forum where a particular bankruptcy case is filed. Financial problems experienced by our customers could result in the impairment of our long-lived assets, reduction of our operating cash flows and may also reduce or curtail their future use of our products and services, which could reduce our revenues. Any material nonpayment or nonperformance by our key customers or our derivative counterparties could adversely affect our cash flow and results of operations.
41
Changes in future business conditions could have a negative impact on the demand for our services and could cause recorded long-lived assets to become further impaired, and our financial condition and results of operations could suffer if there is a negative impact on the demand for our services and an additional impairment of long-lived assets.
We evaluate long-lived assets, including related intangibles, for impairment when events or changes in circumstances indicate, in management's judgment, that the carrying value of such assets may not be recoverable. Asset recoverability is measured by comparing the carrying value of the asset or asset group with its expected future pre-tax undiscounted cash flows. These cash flow estimates require us to make projections and assumptions for many years into the future for pricing, demand, competition, operating cost and other factors. Global oil and natural gas commodity prices, particularly crude oil, have declined substantially as compared to the peak of pricing in mid-2014 and remain volatile. Decreases in commodity prices have previously had, and could continue to have, a negative impact on the demand for our services and our market capitalization.
Should energy industry conditions deteriorate, there is a possibility that long-lived assets may be impaired in a future period. For example, in the first quarter of 2020, we recorded non-cash pre-tax impairments of $2,442.8 million primarily associated with the partial impairment of gas processing facilities and gathering systems associated with our Mid-Continent operations and full impairment of our Coastal operations - all of which are in our Gathering and Processing segment. Any additional impairment charges that we may take in the future could be material to our financial statements. We cannot accurately predict the amount and timing of any impairment of long-lived assets. For a further discussion of our impairments of long-lived assets, see Note 5 — Property, Plant and Equipment and Intangible Assets of the “Consolidated Financial Statements” included in this Annual Report.
Our hedging activities may not be effective in reducing the variability of our cash flows and may, in certain circumstances, increase the variability of our cash flows. Moreover, our hedges may not fully protect us against volatility in basis differentials. Finally, the percentage of our expected equity commodity volumes that are hedged decreases substantially over time.
We have entered into derivative transactions related to only a portion of our equity volumes, future commodity purchases and sales, and transportation basis risk. As a result, we will continue to have direct commodity price risk to the unhedged portion. Our actual future volumes may be significantly higher or lower than we estimated at the time we entered into the derivative transactions for that period. If the actual amount is higher than we estimated, we will have greater commodity price risk than we intended. If the actual amount is lower than the amount that is subject to our derivative financial instruments, we might be forced to satisfy all or a portion of our derivative transactions without the benefit of the cash flow from our sale of the underlying physical commodity. The percentages of our expected equity volumes that are covered by our hedges decrease over time. To the extent we hedge our commodity price risk, we may forego the benefits we would otherwise experience if commodity prices were to change in our favor. The derivative instruments we utilize for these hedges are based on posted market prices, which may be higher or lower than the actual natural gas, NGL and condensate prices that we realize in our operations. These pricing differentials may be substantial and could materially impact the prices we ultimately realize. Market and economic conditions may adversely affect our hedge counterparties’ ability to meet their obligations. Given volatility in the financial and commodity markets, we may experience defaults by our hedge counterparties. In addition, our exchange traded futures are subject to margin requirements, which creates variability in our cash flows as commodity prices fluctuate.
As a result of these and other factors, our hedging activities may not be as effective as we intend in reducing the variability of our cash flows, and in certain circumstances may actually increase the variability of our cash flows. See “Item 7A. Quantitative and Qualitative Disclosures About Market Risk.”
If we fail to balance our purchases and sales of the commodities we handle, our exposure to commodity price risk will increase.
We may not be successful in balancing our purchases and sales of the commodities we handle. In addition, a producer could fail to deliver promised volumes to us or deliver in excess of contracted volumes, or a purchaser could purchase less than contracted volumes. Any of these actions could cause an imbalance between our purchases and sales. If our purchases and sales are not balanced, we will face increased exposure to commodity price risks and could have increased volatility in our operating income.
The implementation of derivatives legislation could have a material adverse effect on our ability to use derivative instruments to reduce the effect of commodity price, interest rate and other risks associated with our business.
The Dodd-Frank Wall Street Reform and Consumer Protection Act (the "Dodd-Frank Act"), enacted on July 21, 2010, established federal oversight and regulation of the over-the-counter derivatives market and entities, such as us, that participate in that market. The Dodd-Frank Act required the CFTC and the SEC to promulgate rules and regulations implementing the Dodd-Frank Act. Although the CFTC has finalized most of these regulations, others remain to be finalized or implemented and it is not possible at this time to predict when this will be accomplished.
42
In October 2020, the CFTC adopted new rules that would place limits on positions in certain core futures and equivalent swaps contracts for or linked to certain physical commodities, subject to exceptions for certain bona fide hedging transactions. The new rules became effective in December 2020 but have a general compliance date of January 1, 2022 and later compliance date of January 1, 2023 with respect to swaps-related requirements and the elimination of previously granted risk management exemptions. The impact of those provisions on us is uncertain at this time.
The CFTC has designated certain interest rate swaps and credit default swaps for mandatory clearing and the associated rules also will require us, in connection with covered derivative activities, to comply with clearing and trade-execution requirements or take steps to qualify for an exemption to such requirements. Although we qualify for the end-user exception from the mandatory clearing requirements for swaps entered to hedge our commercial risks, the application of the mandatory clearing and trade execution requirements to other market participants, such as swap dealers, may change the cost and availability of the swaps that we use for hedging. The CFTC and the federal banking regulators have adopted regulations requiring certain counterparties to swaps to post initial and variation margin. However, our current hedging activities would qualify for the non-financial end user exemption from the margin requirements.
The full impact of the Dodd-Frank Act and related regulatory requirements upon our business will not be known until all of the regulations are implemented and the market for derivatives contracts has adjusted. The Dodd-Frank Act and any new regulations could significantly increase the cost of derivative contracts, materially alter the terms of derivative contracts, reduce the availability of derivatives to protect against risks we encounter, reduce our ability to monetize or restructure our existing derivative contracts or increase our exposure to less creditworthy counterparties. If we reduce our use of derivatives as a result of the Dodd-Frank Act and regulations implementing the Dodd-Frank Act, our results of operations may become more volatile and our cash flows may be less predictable, which could adversely affect our ability to plan for and fund capital expenditures.
Finally, the Dodd-Frank Act was intended, in part, to reduce the volatility of oil and natural gas prices, which some legislators attributed to speculative trading in derivatives and commodity instruments related to oil and natural gas. Our revenues could therefore be adversely affected if a consequence of the Dodd-Frank Act and implementing regulations is to lower commodity prices.
Any of these consequences could have a material adverse effect on us, our financial condition and our results of operations.
The European Union (the “EU”) and other non-U.S. jurisdictions are also implementing regulations with respect to the derivatives market. To the extent we enter into swaps with counterparties in foreign jurisdictions or counterparties with other businesses that subject them to regulation in foreign jurisdictions, we may become subject to or otherwise impacted by such regulations. As is the case with the Dodd-Frank Act and the regulations promulgated under it, the implementing regulations adopted by the EU and by other non-U.S. jurisdictions could have a material adverse effect on us, our financial condition and our results of operations.
Risks Related to Our Indebtedness
Increases in interest rates could adversely affect our business.
We have significant exposure to increases in interest rates. As of December 31, 2020, our total indebtedness was $7,246.0 million, excluding $0.2 million of net premiums and $45.5 million of net debt issuance costs, of which $6,585.2 million was at fixed interest rates, $630.0 million was at variable interest rates and $30.8 million of finance lease liabilities. A hypothetical change of 100 basis points in the rate of our variable interest rate debt would impact our annual interest expense by $6.3 million based on our December 31, 2020 debt balances. As a result of this amount of variable interest rate debt, our results of operations could be adversely affected by increases in interest rates.
We have a substantial amount of indebtedness which may adversely affect our financial position and we may still be able to incur substantially more debt, which could collectively increase the risks associated with compliance with our financial covenants.
We have a substantial amount of indebtedness. As of December 31, 2020, we had $6,530.6 million outstanding of our senior unsecured notes and $54.6 million of outstanding senior notes of TPL, excluding $0.2 million of unamortized net discounts and premiums. We also had $350.0 million outstanding under our Securitization Facility. In addition, we had $44.4 million of letters of credit outstanding and $1,875.6 million of additional borrowing capacity available under the TRP Revolver. Our $2.2 billion TRP Revolver allows us to request increases in commitments up to an additional $500 million. For the years ended December 31, 2020, 2019 and 2018, our consolidated interest expense, net was $378.8 million, $320.8 million and $170.0 million.
In August 2020, we issued $1.0 billion aggregate principal amount of 4⅞% Senior Notes due 2031, resulting in total net proceeds of approximately $991 million. A portion of the net proceeds from the issuance were used to fund the August Tender Offer and redeem any 6¾% Notes that remained outstanding after consummation of the August Tender Offer, with the remainder used for repayment of borrowings under the TRP Revolver.
43
Our substantial level of indebtedness increases the possibility that we may be unable to generate cash sufficient to pay, when due, the principal of, interest on or other amounts due in respect of indebtedness. This substantial indebtedness, combined with lease and other financial obligations and contractual commitments, could have other important consequences to us, including the following:
|
|
• |
our ability to obtain additional financing, if necessary, for working capital, capital expenditures, acquisitions or other purposes may be impaired or such financing may not be available on favorable terms; |
|
|
• |
satisfying our obligations with respect to indebtedness may be more difficult and any failure to comply with the obligations of any debt instruments could result in an event of default under the agreements governing such indebtedness; |
|
|
• |
we will need a portion of cash flow to make interest payments on debt, reducing the funds that would otherwise be available for operations and future business opportunities; |
|
|
• |
our debt level may influence how counterparties view our creditworthiness, which could limit our ability to enter into commercial transactions at favorable rates or require us to post additional collateral in commercial transactions; |
|
|
• |
our debt level will make us more vulnerable to competitive pressures or a downturn in our business or the economy generally; and |
|
|
• |
our debt level may limit flexibility in planning for, or responding to, changing business and economic conditions. |
Our long-term unsecured debt is currently rated by Standard & Poor’s Corporation (“S&P”) and Moody’s Investors Service, Inc. (“Moody’s”). As of December 31, 2020, Targa’s senior unsecured debt was rated “BB” by S&P. As of December 31, 2020, Targa’s senior unsecured debt was rated “Ba3” by Moody’s. Any future downgrades in our credit ratings could negatively impact our cost of raising capital, and a downgrade could also adversely affect our ability to effectively execute aspects of our strategy and to access capital in the public markets.
Our ability to service our debt will depend upon, among other things, our future financial and operating performance, which will be affected by prevailing economic conditions and financial, business, regulatory and other factors, some of which are beyond our control. If our operating results are not sufficient to service our current or future indebtedness, we will be forced to take actions such as reducing or delaying business activities, investments or capital expenditures, acquisitions, selling assets, restructuring or refinancing debt, or seeking additional equity capital, and such results may adversely affect our ability to make cash distributions. We may not be able to affect any of these actions on satisfactory terms, or at all.
We may be able to incur substantial additional indebtedness in the future. The TRP Revolver provides available commitments of $2.2 billion and allows us to request increases in commitments up to an additional $500 million. Although our debt agreements contain restrictions on the incurrence of additional indebtedness, these restrictions are subject to a number of significant qualifications and exceptions, and any indebtedness incurred in compliance with these restrictions could be substantial. If we incur additional debt, this could increase the risks associated with compliance with our financial covenants.
The terms of our debt agreements may restrict our current and future operations, particularly our ability to respond to changes in business or to take certain actions.
The agreements governing our outstanding indebtedness contain, and any future indebtedness we incur will likely contain, a number of restrictive covenants that impose significant operating and financial restrictions, including restrictions on our ability to engage in acts that may be in our best long-term interests. These agreements include covenants that, among other things, restrict our ability to:
|
|
• |
incur or guarantee additional indebtedness or issue preferred units; |
|
|
• |
pay distributions on our equity securities or to our equity holders or redeem, repurchase or retire our equity securities or subordinated indebtedness; |
|
|
• |
make investments and certain acquisitions; |
|
|
• |
sell or transfer assets, including equity securities of our subsidiaries; |
|
|
• |
engage in affiliate transactions, |
|
|
• |
consolidate or merge; |
|
|
• |
incur liens; |
|
|
• |
prepay, redeem and repurchase certain debt, subject to certain exceptions; |
44
|
|
• |
enter into sale and lease-back transactions or take-or-pay contracts; and |
|
|
• |
change business activities conducted by us. |
In addition, certain of our debt agreements require us to satisfy and maintain specified financial ratios and other financial condition tests. Our ability to meet those financial ratios and tests can be affected by events beyond our control, and we cannot assure you that we will meet those ratios and tests.
A breach of any of these covenants could result in an event of default under our debt agreements. Upon the occurrence of such an event of default, all amounts outstanding under the applicable debt agreements could be declared to be immediately due and payable and all applicable commitments to extend further credit could be terminated. For example, if we are unable to repay the accelerated debt under the TRP Revolver, the lenders under the TRP Revolver could proceed against the collateral granted to them to secure that indebtedness. If we are unable to repay the accelerated debt under the Securitization Facility, the lenders under the Securitization Facility could proceed against the collateral granted to them to secure the indebtedness. We have pledged the assets and equity of certain of our subsidiaries as collateral under the TRP Revolver and the accounts receivables of Targa Receivables LLC under the Securitization Facility. If the indebtedness under our debt agreements is accelerated, we cannot assure you that we will have sufficient assets to repay the indebtedness. The operating and financial restrictions and covenants in these debt agreements and any future financing agreements may adversely affect our ability to finance future operations or capital needs or to engage in other business activities.
The credit and business risk profile of our general partner could adversely affect our credit ratings and profile.
The credit and business risk profiles of our general partner may be factors in credit evaluations of us. This is because our general partner can exercise significant influence over our business, including our cash distribution and acquisition strategy and business risk profile. Another factor that may be considered is the financial condition of our general partner, including the degree of its financial leverage and its dependence on cash flow from us to service its indebtedness.
Targa, the owner of our general partner and all of our common units, is dependent on the cash distributions from its indirect general partner and limited partner equity interests in us to provide working capital. Any distributions by us to such entities will be made only after satisfying our then-current obligations to our creditors. Our credit ratings and business risk profile could be adversely affected if the ratings and risk profiles of the entities that control our general partner were viewed as substantially lower or more risky than ours.
Risks Related to Regulatory Matters
Our and our customers’ operations are subject to a number of risks arising out of the threat of climate change (including legislation or regulation to address climate change) that could result in increased operating costs, limit the areas in which oil and natural gas production may occur, and reduce demand for the products and services we provide.
The threat of climate change continues to attract considerable attention in the United States and in foreign countries. As a result, numerous proposals have been made and could continue to be made at the international, national, regional and state levels of government to monitor and limit existing emissions of GHGs as well as to restrict or eliminate such future emissions. As a result, our operations as well as the operations of our oil and natural gas exploration and production customers are subject to a series of executive, regulatory, political, litigation, and financial risks associated with the production and processing of fossil fuels and emission of GHGs.
45
In the United States, no comprehensive climate change legislation has been implemented at the federal level, but President Biden has announced plans to take action with regards to climate change, has already signed several executive orders to this effect in January 2021 and, with control of Congress shifting in January 2021, is expected to pursue legislative as well as other executive and regulatory initiatives in the future to limit GHG emissions. Moreover, because the U.S. Supreme Court has held that GHG emissions constitute a pollutant under the CAA, the EPA has adopted rules that, among other things, establish construction and operating permit reviews for GHG emissions from certain large stationary sources, require the monitoring and annual reporting of GHG emissions from certain petroleum and natural gas system sources, implement New Source Performance Standards (“NSPS”) directing the reduction of methane from certain new, modified, or reconstructed facilities in the oil and natural gas sector, and together with the DOT, implement GHG emissions limits on vehicles manufactured for operation in the United States. In recent years, there has been considerable uncertainty surrounding regulation of the emissions of methane, which may be released during hydraulic fracturing, as the EPA under the Obama Administration published final regulations under the CAA establishing performance standards in 2016, but since that time the EPA under the Trump Administration has undertaken several measures to delay implementation of the methane standards, including publishing in September 2020 final rule policy and technical amendments to the NSPS, for stationary sources of air emissions. The policy amendments, effective September 14, 2020, notably removed the transmission and storage sector from the regulated source category and rescinded methane and VOC requirements for the remaining sources that were established by former President Obama's Administration, whereas the technical amendments, effective November 16, 2020, included changes to fugitive emissions monitoring and repair schedules for gathering and boosting compressor stations and low-production wells, recordkeeping and reporting requirements, and more. Various industry and environmental groups are separately challenging both the 2016 standards and the EPA’s September 2020 final rules and on January 20, 2021, President Biden issued an executive order, that among other things, directed EPA to reconsider the technical amendments and issue a proposed rule suspending, revising or rescinding those amendments by no later than September 2021. A reconsideration of the September 2020 policy amendments is expected to follow. The January 20, 2021 executive order also directed the establishment of new methane and volatile organic compound standards applicable to existing oil and gas operations, including the production, transmission, processing and storage segments. Separately, various states and groups of states have adopted or are considering adopting legislation, regulations or other regulatory initiatives that are focused on such areas as GHG cap and trade programs, carbon taxes, reporting and tracking programs, and restriction of emissions.
At the international level, the non-binding “Paris Agreement” calls for parties to undertake efforts to limit their GHG emissions through individually-determined reduction goals every five years beginning in 2020. Although the United States under the Trump Administration withdrew from the agreement, President Biden has issued executive orders in January 2021 recommitting the United States to the Paris Agreement and calling for the federal government to begin formulating the United States’ nationally determined emissions reduction goal under the agreement. With the United States recommitting to the Paris Agreement, executive orders may be issued or federal legislation or regulatory initiatives may be adopted to achieve the agreement’s goals, which could require us or our customers to incur increased, potentially significant, costs to comply with such requirements.
Governmental, scientific, and public concern over the threat of climate change arising from GHG emissions has resulted in increasing political risks in the United States. Beyond the Biden Administration’s recommitting the United States to the Paris Agreement and proposing to issue more stringent methane standards, on January 20, 2021, the Acting Secretary of the U.S. Department of the Interior issued an order, effective immediately, that suspends new oil and gas leases and drilling permits on non-Indian federal lands and waters for a period of 60 days. Building on this suspension, President Biden issued an executive order on January 27, 2021 that suspends new leasing activities for oil and gas exploration and production on non-Indian federal lands and offshore waters pending completion of a comprehensive review and reconsideration of federal oil and gas permitting and leasing practices that take into consideration potential climate and other impacts associated with oil and gas activities on such lands and waters. The January 20, 2021 and January 27, 2021 orders do not apply to existing leases and the January 27, 2021 order further directs applicable agencies to eliminate fossil fuel subsidies. Legal challenges to these suspensions are expected, with at least one industry group filing a lawsuit on January 27, 2021, in Wyoming federal district court and seeking to have the moratorium on leasing declared invalid.
Litigation risks are also increasing, as a number of states, municipalities and other plaintiffs have sought to bring suit against the largest oil and natural gas exploration and production companies in state or federal court, alleging, among other things, that such companies created public nuisances by producing fuels that contributed to global warming effects, such as rising sea levels, and therefore are responsible for roadway and infrastructure damages as a result, or alleging that the companies have been aware of the adverse effects of climate change for some time but defrauded their investors by failing to adequately disclose those impacts.
46
There are also increasing financial risks for fossil fuel producers as well as other companies handling fossil fuels, including owners of terminals, pipelines and refineries, as stockholders and bondholders currently invested in fossil fuel energy companies concerned about the potential effects of climate change may elect in the future to shift some or all of their investments into non-fossil fuel energy related sectors. Institutional investors who provide financing to fossil fuel energy companies also have become more attentive to sustainability lending practices and some of them may elect not to provide funding for fossil fuel energy companies. Additionally, the lending and investment practices of institutional lenders have been the subject of intensive lobbying efforts in recent years, oftentimes public in nature, by environmental activists, proponents of the international Paris Agreement, and foreign citizenry concerned about climate change not to provide funding for fossil fuel producers. Limitation of investments in and financings for fossil fuel energy companies could result in the restriction, delay, or cancellation of drilling programs or development of production activities.
The adoption and implementation of any international, federal or state executive actions, legislation, or regulatory initiatives that impose more stringent standards for GHG emissions from the oil and natural gas sector or otherwise restrict the areas in which this sector may produce oil and natural gas or generate GHG emissions could result in increased costs of compliance or costs of consuming, and thereby reduce demand for oil and natural gas, which could reduce demand for our services and products. Additionally, political, litigation, and financial risks may result in our oil and natural gas customers restricting or cancelling production activities, incurring liability for infrastructure damages as a result of climatic changes, or impairing their ability to continue to operate in an economic manner, which also could reduce demand for our services and products. One or more of these developments could have a material adverse effect on our business, financial condition and results of operation. Moreover, the increased competitiveness of alternative energy sources (such as wind, solar geothermal, tidal and biofuels) could reduce demand for hydrocarbons, and therefore for our services, which would lead to a reduction in our revenues. Finally, increasing concentrations of GHG in the Earth's atmosphere may produce climate changes that have significant physical effects, such as increased frequency and severity of storms, droughts, floods, rising sea levels and other climatic events. If any such climate changes were to occur, they could have a material adverse effect on our financial condition and results of operations and the financial condition and operations of our customers.
Increasing attention to environmental, social and governance (ESG) matters may impact our business.
Increasing attention to climate change, increasing societal expectations on companies to address climate change, and potential consumer use of substitutes to energy commodities may result in increased costs, reduced demand for our customers’ products and our services, reduced profits, increased investigations and litigation, and negative impacts on our access to capital markets. Increasing attention to climate change, for example, may result in demand shifts for our customers’ hydrocarbon products and additional governmental investigations and private litigation against those customers.
In addition, organizations that provide information to investors on corporate governance and related matters have developed ratings processes for evaluating companies on their approach to ESG matters. Additionally, we and other companies in our industry publish sustainability reports that are made available to investors. Such ratings and reports are used by some investors to inform their investment and voting decisions. Unfavorable ESG ratings may lead to increased negative investor sentiment toward us or our customers and to the diversion of investment to other industries which could have a negative impact on our stock price and/or our access to and costs of capital.
We could incur significant costs in complying with more stringent occupational safety and health requirements.
We are subject to stringent federal and state laws and regulations, including the federal Occupational Safety and Health Act and comparable state statutes, whose purpose is to protect the health and safety of workers, both generally and within the pipeline industry. In addition, the federal Occupational Safety and Health Administration’s (“OSHA”) hazard communication standard, the EPA community right-to-know regulations under Title III of the Federal Superfund Amendment and Reauthorization Act and comparable state statutes require that information be maintained concerning hazardous materials used or produced in our operations and that this information be provided to employees, state and local government authorities and citizens. We and the entities in which we own an interest are subject to OSHA Process Safety Management regulations, which are designed to prevent or minimize the consequences of catastrophic releases of toxic, reactive, flammable or explosive chemicals. The regulations apply to any process that (1) involves a listed chemical in a quantity at or above the threshold quantity specified in the regulation for that chemical, or (2) involves certain flammable gases or flammable liquids present on site in one location in a quantity of 10,000 pounds or more. Flammable liquids stored in atmospheric tanks below their normal boiling point without the benefit of chilling or refrigeration are exempt. Failure to comply with these laws and regulations or any newly adopted laws or regulations may result in assessment of sanctions including administrative, civil and criminal penalties, the imposition of investigatory, remedial and corrective action obligations or the incurrence of capital expenditures, any of which could have a material adverse effect on our business, financial condition and results of operations.
47
Laws and regulations regarding hydraulic fracturing could result in restrictions, delays or cancellations in drilling and completing new oil and natural gas wells by our customers, which could adversely impact our revenues by decreasing the volumes of natural gas, NGLs or crude oil through our facilities and reducing the utilization of our assets.
While we do not conduct hydraulic fracturing, many of our oil and gas exploration and production customers do perform such activities. The process is typically regulated by state oil and gas commissions, but several federal agencies have asserted regulatory authority over, proposed or promulgated regulations governing, and conducted investigations relating to certain aspects of the process, including the EPA and BLM. The BLM under the Obama Administration issued a rule in 2015 regulating hydraulic fracturing activities on federal lands including requirements for disclosure, wellbore integrity and handling of flowback water; however, in late 2017, the BLM under the Trump Administration issued a rescission of the 2015 rule on hydraulic fracturing but a federal district court vacated the 2017 rescission in July 2020. In another example, in late 2016, the EPA released its final report on the potential impacts of hydraulic fracturing on drinking water resources, concluding that “water cycle” activities associated with hydraulic fracturing may impact drinking water resources under certain circumstances.
In addition, although Congress has from time to time considered but refused to adopt legislation to provide for federal regulation of hydraulic fracturing, there is a possibility that a Biden Administration will consider such legislation and, in any event has already issued executive orders, and may issue additional orders, suspending leasing and permitting of oil and gas activities on federal lands and waters that have the effect of limiting hydraulic fracturing. Moreover, many states, including Texas, Louisiana and Oklahoma, have already adopted, and others may consider adopting, legal requirements that impose stringent permitting, disclosure or well construction requirements on hydraulic fracturing activities, assess more taxes, fees or royalties on natural gas production, or otherwise limit the use of the technique. States could elect to prohibit hydraulic fracturing or high volume hydraulic fracturing altogether, as several states have already done. Local governments may also seek to adopt ordinances within their jurisdictions regulating the time, place and manner of drilling activities in general or hydraulic fracturing activities in particular. Additionally, non-governmental organizations may seek to restrict hydraulic fracturing through litigation, state ballot initiatives, or protests. New or more stringent executive orders, laws, regulations or regulatory or ballot initiatives relating to the hydraulic fracturing process could lead to our customers reducing crude oil and natural gas drilling activities using hydraulic fracturing techniques, while increased litigation against, or public opposition with respect to activities using such techniques may result in operational delays, restrictions or cessations or bans. Any one or more of such developments could reduce demand for our gathering, processing and fractionation services and have a material adverse effect on our business, financial condition and results of operations.
Our operations are subject to environmental laws and regulations and a failure to comply or an accidental release into the environment may cause us to incur significant costs and liabilities.
Our operations are subject to numerous federal, tribal, state and local environmental laws and regulations governing occupational health and safety, the discharge of pollutants into the environment or otherwise relating to environmental protection. These laws and regulations may impose numerous obligations that are applicable to our operations including acquisition of a permit or other approval before conducting regulated activities, restrictions on the types, quantities and concentration of materials that can be released into the environment; limitation or prohibition of construction and operating activities in environmentally sensitive areas such as wetlands, urban areas, wilderness regions and other protected areas; requiring capital expenditures to comply with pollution control requirements, and imposition of substantial liabilities for pollution resulting from our operations. Numerous governmental authorities, such as the EPA and BLM, and analogous state agencies, have the power to enforce compliance with these laws and regulations and the permits and approvals issued under them, which can often require difficult and costly actions. Failure to comply with these laws and regulations or any newly adopted laws or regulations may result in assessment of sanctions including administrative, civil and criminal penalties, the imposition of investigatory, remedial and corrective action obligations or the incurrence of capital expenditures; the occurrence of restrictions, delays or cancellations in the permitting or performance of projects, and the issuance of orders enjoining or conditioning performance of some or all of our operations in a particular area. Certain environmental laws impose strict, joint and several liability for costs required to clean up and restore sites where hazardous substances, hydrocarbons or waste products have been released, even under circumstances where the substances, hydrocarbons or wastes have been released by a predecessor operator or the activities conducted and from which a release emanated complied with applicable law. Moreover, it is not uncommon for neighboring landowners and other third parties to file claims for personal injury and property damage allegedly caused by noise, odor, or the release of hazardous substances, hydrocarbons or wastes into the environment.
The risk of incurring environmental costs and liabilities in connection with our operations is significant due to our handling of natural gas, NGLs, crude oil and other petroleum products, because of air emissions and product-related discharges arising out of our operations, and as a result of historical industry operations and waste disposal practices. For example, an accidental release from one of our facilities could subject us to substantial liabilities arising from environmental cleanup and restoration costs, claims made by neighboring landowners and other third parties for personal injury, natural resource and property damages and fines or penalties for related violations of environmental laws or regulations.
48
Moreover, stricter laws, regulations or enforcement policies could significantly increase our operational or compliance costs and the cost of any remediation that may become necessary. For example, in 2015, the EPA under the Obama Administration issued a final rule under the CAA, lowering the National Ambient Air Quality Standard (“NAAQS”) for ground-level ozone. Since that time, the EPA under the Trump Administration has designated attainment and non-attainment regions and, more recently, on December 31, 2020, published notice of a final action that, upon conducting a periodic review of the ozone standard in accord with CAA requirements, elected to retain the 2015 ozone NAAQS without revision on a going-forward basis. However, this December 2020 final action is subject to legal challenge, and the NAAQS may be subject to further revision under the Biden Administration. State implementation of the revised ozone NAAQS could increase our compliance costs. Also in 2015, the EPA and U.S. Army Corps of Engineers (“Corps”) under the Obama administration published a final rule outlining federal jurisdictional reach under the Clean Water Act over waters of the United States, including wetlands; however, the 2015 rule was repealed by the EPA and the Corps under the Trump Administration in a final rule that became effective in December 2019. The Trump Administration subsequently published a final rule in April 2020 re-defining the term “waters of the United States” as applied under the Clean Water Act and narrowing the scope of waters subject to federal regulation. The April 2020 final rule is subject to various pending legal challenges and it is expected that a Biden Administration may reconsider this final rule. If the EPA and the Corps under the Biden Administration revises the June 2020 final rule in a manner similar to or more stringent than the original 2015 final rule, or if any challenge to the June 2020 final rule is successful, the scope of the Clean Water Act’s jurisdiction in areas where we or our customers conduct operations could again be expanded. Any such developments could delay, restrict or halt permitting or development of projects, result in longer permitting timelines, or increased compliance expenditures or mitigation costs for our and our oil and natural gas customers’ operations. These results may consequently reduce the rate of production of natural gas or crude oil from operators with whom we have a business relationship and, in turn, have a material adverse effect on our business, results of operations and cash flows.
A change in the jurisdictional characterization of some of our assets by federal, state, tribal or local regulatory agencies or a change in policy by those agencies may result in increased regulation of our assets, which may cause our revenues to decline and operating expenses to increase or delay or increase the cost of expansion projects.
With the exception of the Driver Residue Pipeline, TPL SouthTex Transmission pipeline and Tarzan 311 residue line, which are each subject to limited FERC regulation under either the NGA or NGPA, our natural gas pipeline operations are generally exempt from FERC regulation, but FERC regulation still affects our non-FERC jurisdictional businesses and the markets for products derived from these businesses, including certain FERC reporting and posting requirements in a given year. We believe that the natural gas pipelines in our gathering systems meet the traditional tests FERC has used to establish a pipeline’s status as a gatherer not subject to regulation as a natural gas company. However, the distinction between FERC-regulated transmission services and federally unregulated gathering services is the subject of substantial, ongoing litigation, so the classification and regulation of our gathering facilities are subject to change based on future determinations by FERC, the courts or Congress. We also operate natural gas pipelines that extend from some of our processing plants to interconnections with both intrastate and interstate natural gas pipelines. Those facilities, known in the industry as “plant tailgate” pipelines, typically operate at transmission pressure levels and may transport “pipeline quality” natural gas. Because our plant tailgate pipelines are relatively short, we treat them as “stub” lines, which are exempt from FERC’s jurisdiction under the Natural Gas Act.
Targa NGL, Targa Gulf Coast, and Grand Prix Joint Venture have pipelines that are considered common carrier pipelines subject to regulation by FERC under ICA. The ICA requires that we maintain tariffs on file with FERC for each of the Targa NGL, Targa Gulf Coast and Grand Prix Joint Venture common carrier pipelines that have not been granted a waiver. Those tariffs set forth the rates we charge for providing transportation services as well as the rules and regulations governing these services. The ICA requires, among other things, that rates on interstate common carrier pipelines be “just and reasonable” and non-discriminatory. With respect to pipelines that have been granted a waiver of the ICA and related regulations by FERC, should a particular pipeline’s circumstances change, FERC could, either at the request of other entities or on its own initiative, assert that such pipeline no longer qualifies for a waiver. In the event that FERC were to determine that one or more of these pipelines no longer qualified for a waiver, we would likely be required to file a tariff with FERC for the applicable pipeline(s), provide a cost justification for the transportation charge, and provide service to all potential shippers without undue discrimination. Such a change in the jurisdictional status of transportation on these pipelines could adversely affect our results of operations.
The classification of some of our gathering facilities, transportation pipelines, and purchase and sale transactions as FERC-jurisdictional or non-jurisdictional may be subject to change based on future determinations by FERC, the courts or Congress, in which case, our operating costs could increase and we could be subject to enforcement actions under the EP Act of 2005.
49
Various federal agencies within the U.S. Department of the Interior, particularly the BLM, Office of Natural Resources Revenue (formerly the Minerals Management Service) and the Bureau of Indian Affairs, along with the Three Affiliated Tribes, promulgate and enforce regulations pertaining to operations on the Fort Berthold Indian Reservation, on which we operate a significant portion of our Badlands gathering and processing assets. The Three Affiliated Tribes is a sovereign nation having the right to enforce certain laws and regulations independent from federal, state and local statutes and regulations. These tribal laws and regulations include various taxes, fees and other conditions that apply to lessees, operators and contractors conducting operations on Native American tribal lands. Lessees and operators conducting operations on tribal lands can generally be subject to the Native American tribal court system. One or more of these factors may increase our costs of doing business on the Fort Berthold Indian Reservation and may have an adverse impact on our ability to effectively transport products within the Fort Berthold Indian Reservation or to conduct our operations on such lands.
Other FERC regulations may indirectly impact our businesses and the markets for products derived from these businesses. FERC’s policies and practices across the range of its natural gas regulatory activities, including, for example, its policies on open access transportation, gas quality, ratemaking, capacity release and market center promotion, may indirectly affect the natural gas market. In recent years, FERC has pursued pro-competitive policies in its regulation of interstate natural gas pipelines. However, we cannot assure you that FERC will continue this approach as it considers matters such as pipeline rates and rules and policies that may affect rights of access to transportation capacity. For more information regarding the regulation of our operations, see “Item 1. Business—Regulation of Operations.”
Federal and state legislative and regulatory initiatives relating to pipeline safety that require the use of new or more stringent safety controls or result in more rigorous enforcement of applicable legal requirements could subject us to increased capital costs, operational delays and costs of operation.
Legislation in the past decade has resulted in more stringent mandates for pipeline safety. In 2016, President Obama signed the Protecting our Infrastructure of Pipelines and Enhancing Safety Act of 2016 (“2016 Pipeline Safety Act”) required PHMSA to complete certain of its outstanding mandates under the Pipeline Safety, Regulatory Certainty, and Job Creation Act of 2011 (“2011 Pipeline Safety Act”). The 2011 Pipeline Safety Act had directed the promulgation of regulations relating to such matters as expanded integrity management requirements, automatic or remote-controlled valve use, excess flow valve use, leak detection system installation, testing to confirm the material strength of certain pipelines and operator verification of records confirming the maximum allowable pressure of certain intrastate gas transmission pipelines. The 2016 Pipeline Safety Act also empowered PHMSA to address unsafe conditions or practices constituting imminent hazards by imposing emergency restrictions, prohibitions and safety measures on owners and operators of gas or hazardous liquid pipeline facilities without prior notice or an opportunity for a hearing. Most recently, in December 2020, Congress passed the Fiscal Year 2021 Omnibus Appropriations Bill, made effective on December 27, 2020, pursuant to which Congress adopted the “Protecting Our Infrastructure of Pipelines and Enhancing Safety (“PIPES”) Act of 2020.” The PIPES Act of 2020 reauthorized PHMSA through federal Fiscal Year 2023 and directed the agency to move forward with several regulatory actions, including the “Pipeline Safety: Class Location Change Requirements” and the “Pipeline Safety: Safety of Gas Transmission and Gathering Pipelines” proposed rulemakings. Congress has also instructed PHMSA to issue final regulations that will require operators of non-rural gas gathering lines and new and existing transmission and distribution pipeline facilities to conduct certain leak detection and repair programs and to require facility inspection and maintenance plans to align with those regulations.
The imposition of new safety enhancement requirements pursuant to the 2011 Pipeline Safety Act, the 2016 Pipeline Safety Act and the PIPES Act of 2020, or any issuance or reinterpretation of guidance by PHMSA or any state agencies with respect thereto could require us to install new or modified safety controls, pursue additional capital projects or conduct maintenance programs on an accelerated basis, any or all of which tasks could result in our incurring increased operating costs that could have a material adverse effect on our results of operations or financial position. Additionally, PHMSA and one or more state regulators, including the RRC, have in recent years expanded the scope of their regulatory inspections to include certain in-plant equipment and pipelines found within NGL fractionation facilities and associated storage facilities, to assess compliance with hazardous liquids pipeline safety requirements. To the extent that PHMSA and/or state regulatory agencies are successful in asserting their jurisdiction in this manner, we and other midstream operators of NGL fractionation facilities and associated storage facilities may be required to make operational changes or modifications at their facilities to meet standards beyond current OSHA PSM and EPA RMP requirements, which changes or modifications may result in additional capital costs, possible operational delays and increased costs of operation that, in some instances, may be significant.
50
Should we fail to comply with all applicable FERC-administered statutes, rules, regulations and orders, we could be subject to substantial penalties and fines.
Under the EP Act of 2005, FERC has civil penalty authority under the NGA and NGPA to impose penalties for violations of the NGA or NGPA, up to approximately $1.3 million (adjusted annually for inflation) per day for each violation and disgorgement of profits associated with any violation. While our systems other than the Driver Residue Pipeline, TPL SouthTex Transmission pipeline and Tarzan 311 residue line, have not been regulated by FERC under the NGA or NGPA, FERC has adopted regulations that may subject certain of our otherwise non-FERC jurisdictional facilities to FERC annual reporting and daily scheduled flow and capacity posting requirements. Additional rules and legislation pertaining to those and other matters may be considered or adopted by FERC from time to time. Failure to comply with those regulations in the future could subject us to civil penalty liability. In addition, FERC has civil penalty authority under the ICA to impose penalties for violations under the ICA of up to approximately $13,685 per violation per day, and failure to comply with the ICA and regulations implementing the ICA could subject us to civil penalty liability. For more information regarding regulation of our operations, see “Item 1. Business—Regulation of Operations.”
We are or may become subject to cybersecurity and data privacy laws, regulations, litigation and directives relating to our processing of personal information.
The jurisdictions in which we operate (including the United States) may have laws governing how we must respond to a cyber incident that results in the unauthorized access, disclosure, or loss of personal information. Additionally, new laws and regulations governing data privacy and unauthorized disclosure of confidential information, including recent California legislation (which, among other things, provides for a private right of action), pose increasingly complex compliance challenges and could potentially elevate our costs over time. Although our business does not involve large-scale processing of personal information, our business does involve collection, use, and other processing of personal information of our employees, investors, contractors, suppliers, and customer contacts. As legislation continues to develop and cyber incidents continue to evolve, we will likely be required to expend significant resources to continue to modify or enhance our protective measures to comply with such legislation and to detect, investigate and remediate vulnerabilities to cyber incidents. Any failure by us, or a company we acquire, to comply with such laws and regulations could result in reputational harm, loss of goodwill, penalties, liabilities, and/or mandated changes in our business practices.
Item 1B. Unresolved Staff Comments.
None.
Item 2. Properties.
A description of our properties is contained in “Item 1. Business” in this Annual Report.
Our principal executive offices are located at 811 Louisiana Street, Suite 2100, Houston, Texas 77002 and our telephone number is 713-584-1000.
Item 3. Legal Proceedings.
On December 26, 2018, Vitol Americas Corp. (“Vitol”) filed a lawsuit in the 80th District Court of Harris County, Texas against Targa Channelview LLC, then a subsidiary of the Company (“Targa Channelview”), seeking recovery of $129.0 million in payments made to Targa Channelview, additional monetary damages, attorneys’ fees and costs. Vitol alleges that Targa Channelview breached an agreement, dated December 27, 2015, for crude oil and condensate between Targa Channelview and Noble Americas Corp. (the “Splitter Agreement”), which provided for Targa Channelview to construct a crude oil and condensate splitter (the “Splitter”) adjacent to a barge dock owned by Targa Channelview to provide services contemplated by the Splitter Agreement. In January 2018, Vitol acquired Noble Americas Corp. and on December 23, 2018, Vitol voluntarily elected to terminate the Splitter Agreement claiming that Targa Channelview failed to timely achieve start-up of the Splitter. Vitol’s lawsuit also alleges Targa Channelview made a series of misrepresentations about the capability of the barge dock that would service crude oil and condensate volumes to be processed by the Splitter and Splitter products. Vitol seeks return of $129.0 million in payments made to Targa Channelview prior to the start-up of the Splitter, as well as additional damages. On the same date that Vitol filed its lawsuit, Targa Channelview filed a lawsuit against Vitol seeking a judicial determination that Vitol’s sole and exclusive remedy was Vitol’s voluntarily termination of the Splitter Agreement and, as a result, Vitol was not entitled to the return of any prior payments under the Splitter Agreement or other damages as alleged. Targa also seeks recovery of its attorneys’ fees and costs in the lawsuit.
On October 15, 2020, the District Court awarded Vitol $129.0 million (plus interest) following a bench trial. In addition, the District Court awarded Vitol $10.5 million in damages for losses and demurrage on crude oil that Vitol purchased for start-up efforts. The Company has filed an appeal challenging the award, and the appeal is currently pending in the Fourteenth Court of Appeals in Houston, Texas.
51
In October 2020, we sold Targa Channelview but, under the agreements governing the sale, we retained the liabilities associated with the Vitol proceedings.
Additional information required for this item is provided in Note 16 – Contingencies, under the heading “Legal Proceedings” included in the Notes to Consolidated Financial Statements included under Part II, Item 8 of this Annual Report, which is incorporated by reference into this item.
Item 4. Mine Safety Disclosures.
Not applicable.
52
PART II
Item 5. Market for Registrant’s Common Equity, Related Stockholder Matters and Issuer Purchases of Equity Securities.
Market Information
On February 17, 2016, TRC completed the TRC/TRP Merger, pursuant to which TRC acquired indirectly all of our outstanding common units that TRC and its subsidiaries did not already own. Pursuant to the TRC/TRP Merger Agreement, TRC agreed to cause our common units under the symbol “NGLS” to be delisted from the NYSE and deregistered under the Exchange Act. As a result of the completion of the TRC/TRP Merger, our common units are no longer publicly traded.
There is no established trading market for the 5,629,136 general partner units held only by our general partner.
Our Preferred Units that were issued in October 2015 were redeemed in December 2020 and are no longer outstanding as of the end of the year. Prior to the redemption, the Preferred Units were limited partner interests in us and were traded on the NYSE under the symbol “NGL/PA.”
Distributions of Available Cash
General
As a result of the TRC/TRP Merger, Targa owns all of our outstanding common units. We have discretion under the Third A&R Partnership Agreement as to whether to distribute all available cash for any period. See Note 8 – Debt Obligations and Note 11 – Partnership Units and Related Matters of the “Consolidated Financial Statements” included in this Annual Report.
Definition of Available Cash
Under the partnership agreement, the term “available cash,” is defined, for any quarter or month, as applicable, as the sum of all cash and cash equivalents on hand at the end of that quarter or month, as applicable, and all additional cash and cash equivalents on hand immediately prior to the date of the distribution of available cash resulting from borrowings for working capital purposes subsequent to the end of that quarter or month, as applicable, less the amount of any cash reserves established by our general partner to:
|
|
• |
provide for the proper conduct of our business (including reserves for future capital expenditures and for anticipated future credit needs); |
|
|
• |
comply with applicable law or any loan agreements, security agreements, mortgages, debt instruments or other agreements; |
|
|
• |
provide funds for distributions on and redemptions with respect to the Preferred Units; or |
|
|
• |
provide funds for further distributions. |
The amount of distributions paid under our policy and the decision to make any distribution is determined by our general partner, taking into consideration the terms of our partnership agreement. The board of directors of our general partner has broad discretion to establish cash reserves that it determines are necessary or appropriate to properly conduct our business. These can also include cash reserves for future capital and maintenance expenditures, reserves to stabilize distributions of cash to our unitholders, reserves to reduce debt or, as necessary, reserves to comply with the terms of any of our agreements or obligations. We will be prohibited from making any distributions to unitholders if it would cause an event of default or if an event of default exists under our credit agreement or indentures.
Preferred Units
Prior to the redemption of our Preferred Units, distributions were cumulative from the date of original issue in October 2015 and were payable monthly in arrears on the 15th day of each month of each year, when, as and if declared by the board of directors of our general partner. Distributions on our Preferred Units were payable out of amounts legally available at a rate equal to 9.0% per annum, until November 1, 2020, when distributions on our Preferred Units started to accumulate at an annual floating rate equal to the one-month LIBOR plus a spread of 7.71%. We paid total distributions of $15.1 million in 2020 and $11.3 million each year in 2019 and 2018 to the Preferred Unitholders. All cumulative distributions were made at the time of redemption, and no additional distributions will be required. See Note 11 - Partnership Units and Related Matters of the “Consolidated Financial Statements” included in this Annual Report.
53
Recent Sales of Unregistered Equity Securities
There were no sales of unregistered equity securities for the year ended December 31, 2020.
Repurchase of Equity by Targa Resources Partners LP or Affiliated Purchasers
None.
Item 6. Selected Financial Data.
The following table presents selected historical consolidated financial and operating data of Targa Resources Partners LP for the periods ended, and as of, the dates indicated. We derived this information from our historical “Consolidated Financial Statements” and accompanying notes. The information in the table below should be read together with, and is qualified in its entirety by reference to, those financial statements and notes in this Annual Report.
|
|
2020 |
|
|
2019 |
|
|
2018 |
|
|
2017 |
|
|
2016 |
|
|||||
|
|
(In millions, except per unit amounts) |
|
|||||||||||||||||
|
Statement of operations data: |
|
|
|
|
|
|
|
|
|
|
|
|
|
|
|
|
|
|
|
|
Revenues (1) |
$ |
8,260.3 |
|
|
$ |
8,671.1 |
|
|
$ |
10,484.0 |
|
|
$ |
8,814.9 |
|
|
$ |
6,690.9 |
|
|
Income (loss) from operations (3) |
|
(1,291.3 |
) |
|
|
206.1 |
|
|
|
253.6 |
|
|
|
(109.4 |
) |
|
|
66.0 |
|
|
Net income (loss) |
|
(1,545.1 |
) |
|
|
(15.6 |
) |
|
|
98.6 |
|
|
|
(250.6 |
) |
|
|
(228.7 |
) |
|
Balance sheet data (at end of period): |
|
|
|
|
|
|
|
|
|
|
|
|
|
|
|
|
|
|
|
|
Total assets (2) |
$ |
15,828.5 |
|
|
$ |
18,744.5 |
|
|
$ |
16,890.1 |
|
|
$ |
14,359.0 |
|
|
$ |
12,744.9 |
|
|
Long-term debt (2) |
|
6,832.1 |
|
|
|
7,005.2 |
|
|
|
5,197.4 |
|
|
|
4,268.0 |
|
|
|
4,177.0 |
|
_________________________________
|
(1) |
Revenues for 2020, 2019 and 2018 include the impact of the adoption of ASU 2014-09, Revenue from Contracts with Customers (Topic 606). See “Revenue Recognition” included within Note 3 – Significant Accounting Policies. |
|
(2) |
Total assets and long-term debt include the impact of the adoption of ASU 2016-02, Leases (Topic 842). See Note 10 – Leases. |
|
(3) |
Includes the impact of pre-tax non-cash impairments of long-lived assets. For a further discussion, see Note 5 — Property, Plant and Equipment and Intangible Assets. |
54
Item 7. Management’s Discussion and Analysis of Financial Condition and Results of Operations.
The following discussion and analysis of our financial condition and results of operations should be read in conjunction with our consolidated financial statements and the notes included in Part IV of this Annual Report. Additional sections in this Annual Report should be helpful to the reading of our discussion and analysis, including the following: (i) a description of our business strategy found in “Item 1. Business–Overview”; (ii) a description of recent developments, found in “Item 1. Business–Recent Developments”; and (iii) a description of risk factors affecting us and our business, found in “Item 1A. Risk Factors.” Discussions of 2018 items and year-to-year comparisons between 2019 and 2018 that are not included in this Annual Report can be found in Part II, Item 7. “Management’s Discussion and Analysis of Financial Condition and Results of Operations” of our Annual Report on Form 10-K for the year ended December 31, 2019.
Overview
Targa Resources Partners LP is a Delaware limited partnership formed in October 2006 by TRC. Our common units were listed on the NYSE under the symbol “NGLS” prior to TRC’s acquisition on February 17, 2016 of all our outstanding common units that it and its subsidiaries did not already own. Our Preferred Units that were issued in October 2015 were redeemed in December 2020 and are no longer outstanding as of the end of the year. Prior to the Redemption Date, the preferred units were limited partner interests in us and were traded on the NYSE under the symbol “NGLS/PA.”
We are engaged primarily in the business of:
|
|
• |
gathering, compressing, treating, processing, transporting and purchasing and selling natural gas; |
|
|
• |
transporting, storing, fractionating, treating and purchasing and selling NGLs and NGL products, including services to LPG exporters; and |
|
|
• |
gathering, storing, terminaling and purchasing and selling crude oil. |
Factors That Significantly Affect Our Results
Our results of operations are impacted by a number of factors, including the volumes that move through our gathering, processing and logistics assets, contract terms, changes in commodity prices, the impact of hedging activities and the cost to operate and support assets.
Commodity Prices
The following table presents selected average annual and quarterly industry index prices for natural gas, selected NGL products and crude oil for the periods presented:
|
|
Natural Gas $/MMBtu (1) |
|
|
Illustrative Targa NGL $/gal (2) |
|
|
Crude Oil $/Bbl (3) |
|
|||
|
2020 |
|
|
|
|
|
|
|
|
|
|
|
|
4th Quarter |
$ |
2.66 |
|
|
$ |
0.47 |
|
|
$ |
42.67 |
|
|
3rd Quarter |
|
1.97 |
|
|
|
0.42 |
|
|
|
40.94 |
|
|
2nd Quarter |
|
1.70 |
|
|
|
0.32 |
|
|
|
27.55 |
|
|
1st Quarter |
|
1.98 |
|
|
|
0.36 |
|
|
|
46.59 |
|
|
2020 Average |
|
2.08 |
|
|
|
0.39 |
|
|
|
39.44 |
|
|
|
|
|
|
|
|
|
|
|
|
|
|
|
2019 |
|
|
|
|
|
|
|
|
|
|
|
|
4th Quarter |
$ |
2.50 |
|
|
$ |
0.49 |
|
|
$ |
56.96 |
|
|
3rd Quarter |
|
2.23 |
|
|
|
0.42 |
|
|
|
56.45 |
|
|
2nd Quarter |
|
2.64 |
|
|
|
0.50 |
|
|
|
59.83 |
|
|
1st Quarter |
|
3.16 |
|
|
|
0.60 |
|
|
|
54.90 |
|
|
2019 Average |
|
2.63 |
|
|
|
0.50 |
|
|
|
57.04 |
|
________________
|
(1) |
Natural gas prices are based on average first of month prices from Henry Hub Inside FERC commercial index prices. |
|
(2) |
“Illustrative Targa NGL” pricing is weighted using average quarterly prices from Mont Belvieu Non-TET monthly commercial index and represents the following composition for the periods noted: |
2020: 43% ethane, 32% propane, 12% normal butane, 4% isobutane and 9% natural gasoline
2019: 38% ethane, 34% propane, 12% normal butane, 5% isobutane and 11% natural gasoline
|
(3) |
Crude oil prices are based on average quarterly prices of West Texas Intermediate crude oil as measured on the NYMEX. |
55
Volumes
In our gathering and processing operations, plant inlet volumes, crude oil volumes and capacity utilization rates generally are driven by wellhead production and our competitive and contractual position on a regional basis and more broadly by the impact of prices for crude oil, natural gas and NGLs on exploration and production activity in the areas of our operations. The factors that impact the gathering and processing volumes also impact the total volumes that flow to our Downstream Business. In addition, fractionation volumes are also affected by the location of the resulting mixed NGLs, available pipeline capacity to transport NGLs to our fractionators and our competitive and contractual position relative to other fractionators.
Contract Terms, Contract Mix and the Impact of Commodity Prices
With the potential for volatility of commodity prices, the contract mix of our Gathering and Processing segment (other than fee-based contracts in certain gathering and processing business units and gathering and processing services), can have a significant impact on our profitability, especially those percent-of-proceeds contracts that create direct exposure to changes in energy prices by paying us for gathering and processing services with a portion of proceeds from the commodities handled (“equity volumes”).
Contract terms in the Gathering and Processing segment are based upon a variety of factors, including natural gas and crude quality, geographic location, competitive dynamics and the pricing environment at the time the contract is executed, and customer requirements. Our gathering and processing contract mix and, accordingly, our exposure to crude, natural gas and NGL prices may change as a result of producer preferences, competition and changes in production as wells decline at different rates or are added, our expansion into regions where different types of contracts are more common and other market factors.
The contract terms and contract mix of our Downstream Business can also have a significant impact on our results of operations. Transportation and fractionation services are supported by fee-based contracts whose rates and terms are driven by NGL supply and transportation and fractionation capacity. Export services are supported by fee-based contracts whose rates and terms are driven by global LPG supply and demand fundamentals. The Logistics and Transportation segment includes predominantly fee-based contracts.
The adoption of ASU 2014-09, Revenue from Contracts with Customers (Topic 606), in January of 2018 did not result in an impact to our operating or gross margin. However, the adoption did have an impact on the classification between components of operating margin and gross margin, “Fees from midstream services” and “Product purchases,” as well as the reporting of gross versus net revenues. For more details, see “Revenue Recognition” included within Note 3 – Significant Accounting Policies.
Impact of Our Commodity Price Hedging Activities
We have hedged the commodity price risk associated with a portion of our expected natural gas, NGL and condensate equity volumes, future commodity purchases and sales, and transportation basis risk by entering into financially settled derivative transactions. These transactions include swaps, futures, and purchased puts (or floors) and calls (or caps) to hedge additional expected equity commodity volumes without creating volumetric risk. We intend to continue managing our exposure to commodity prices in the future by entering into derivative transactions. We actively manage the Downstream Business product inventory and other working capital levels to reduce exposure to changing prices. For additional information regarding our hedging activities, see “Item 7A. Quantitative and Qualitative Disclosures About Market Risk–Commodity Price Risk.”
Operating Expenses
Variable costs such as fuel, utilities, power, service and repairs can impact our results. The fuel and power costs are pass-through elements in many of our contracts, which mitigates their impact on our results. Continued expansion of existing assets will also give rise to additional operating expenses, which will affect our results. The employees supporting our operations are employees of Targa Resources LLC, a Delaware limited liability company, and an indirect wholly-owned subsidiary of Targa. We reimburse Targa for the payment of certain operating expenses, including compensation and benefits of operating personnel assigned to our assets.
General and Administrative Expenses
Our partnership agreement with Targa, our general partner, addresses the reimbursement of costs incurred on our behalf and indemnification matters. Targa performs centralized corporate functions for us, such as legal, accounting, treasury, insurance, risk management, health, safety, environmental, information technology, human resources, credit, payroll, internal audit, taxes, engineering and marketing. Other than Targa’s direct costs of being a separate public reporting company, we reimburse these costs. See “Item 13. Certain Relationships and Related Transactions, and Director Independence.”
56
General Trends and Outlook
We expect the midstream energy business environment to continue to be affected by the following key trends: demand for our products and services, commodity prices, volatile capital markets, competition and increased regulation. These expectations are based on assumptions made by us and information currently available to us. To the extent our underlying assumptions about or interpretations of available information prove to be incorrect, our actual results may vary materially from our expected results.
Demand for Our Services
Fluctuations in energy prices can greatly affect production rates and investments by third parties in the development and production of new oil and natural gas reserves. Our operations are affected by the level of crude, natural gas and NGL prices, the relationship among these prices and related activity levels from our customers. Drilling and production activity generally decreases as crude oil and natural gas prices decrease below commercially acceptable levels. Producers generally focus their drilling activity on certain basins depending on commodity price fundamentals. As a result, our asset systems are predominantly located in some of the most economic basins in the United States. Accordingly, increased producer activity will drive demand for our midstream services and may result in incremental growth capital expenditures. Demand for our transportation, fractionation and other fee-based services is largely correlated with producer activity levels. Demand for our international export, storage and terminaling services has remained relatively constant, as demand for these services is based on a number of domestic and international factors.
During 2020, as a result of the COVID-19 pandemic and related travel restrictions, combined with uncertainty around global commodity supply and demand, commodity prices declined substantially, which led many exploration and production companies to reduce planned capital expenditures for drilling and production activities and also led to some companies shutting-in wells in the first half of 2020. Such activity declines negatively impacted our operations and demand for our services. While production from wells that were previously shut-in during the first half of 2020 across our operating areas has largely resumed, we are uncertain of what pricing and market demand, and the associated demand for our services, will be throughout 2021.
Commodity Prices
There has been, and we believe there will continue to be, volatility in commodity prices and in the relationships among NGL, crude oil and natural gas prices. As a result of reduced economic activity due to the COVID-19 pandemic paired with uncertainty around global commodity supply and demand, global oil and natural gas commodity prices remain weak relative to historical levels and continue to remain volatile. The volatility and uncertainty of natural gas, crude oil and NGL prices impact drilling, completion and other investment decisions by producers and ultimately supply to our systems. See “Item 1A. Risk Factors – Our cash flow is affected by supply and demand for natural gas, NGL products and crude oil and by natural gas, NGL, crude oil and condensate prices, and decreases in supply, demand or these prices could adversely affect our results of operations and financial condition.”
Our operating income generally improves in an environment of higher natural gas, NGL and condensate prices, and where the spread between NGL prices and natural gas prices widens primarily as a result of our percent-of-proceeds contracts. Our processing profitability is largely dependent upon pricing and the supply of and market demand for natural gas, NGLs and condensate. Pricing and supply are beyond our control and have been volatile. In a declining commodity price environment, without taking into account our hedges, we will realize a reduction in cash flows under our percent-of-proceeds contracts proportionate to average price declines.
Across our operations and particularly in our Downstream Business, we benefit from long-term fee-based arrangements for our services. Our Gathering and Processing segment contract mix also has components of fee-based margin, such as fee floors and other fee-based services which mitigate against low commodity prices. The significant level of margin we derive from fee-based arrangements combined with our hedging arrangements helps to mitigate our exposure to commodity price movements. For additional information regarding our hedging activities, see “Item 7A. Quantitative and Qualitative Disclosures about Market Risk — Commodity Price Risk.”
Volatile Capital Markets and Competition
We continuously consider and enter into discussions regarding potential growth projects and acquisitions and identify appropriate private and public capital sources for funding potential growth projects and acquisitions. Any limitations on our access to capital may impair our ability to execute this strategy. If the cost of such capital becomes too expensive, our ability to develop or acquire strategic and accretive assets may be limited. We may not be able to raise the necessary funds on satisfactory terms, if at all. The primary factors influencing our cost of borrowing include interest rates, credit spreads, covenants, underwriting or loan origination fees and similar charges we pay to lenders. These factors may impair our ability to execute our growth and acquisition strategy.
57
Current economic conditions and competition for asset purchases and development opportunities could limit our ability to fully execute our growth strategy. Due to increased volatility in commodity prices and the broader market, the ability of companies in the oil and gas industry to seek financing and access the capital markets on favorable terms or at all has been negatively impacted. We believe we have sufficient access to financial resources and liquidity necessary to meet our requirements for working capital, debt service payments and capital expenditures in 2021 and beyond. For additional information regarding our financing activities, see “Item 1. Business—Recent Developments—Financing Activities.”
Increased Regulation
Additional regulation in various areas has the potential to materially impact our operations and financial condition. For example, increased regulation of hydraulic fracturing used by producers and increased GHG emission regulations may cause reductions in supplies of natural gas, NGLs and crude oil from producers. Please read “Laws and regulations regarding hydraulic fracturing could result in restrictions, delays or cancellations in drilling and completing new oil and natural gas wells by our customers, which could adversely impact our revenues by decreasing the volumes of natural gas, NGLs or crude oil through our facilities and reducing the utilization of our assets” and “Our and our customers’ operations are subject to a number of risks arising out of the threat of climate change (including legislation or regulation to address climate change) that could result in increased operating costs, limit the areas in which oil and natural gas production may occur, and reduce demand for the products and services we provide” under Item 1A of this Annual Report. Similarly, the forthcoming rules and regulations of the CFTC may limit our ability or increase the cost to use derivatives, which could create more volatility and less predictability in our results of operations.
How We Evaluate Our Operations
The profitability of our business is a function of the difference between: (i) the revenues we receive from our operations, including fee-based revenues from services and revenues from the natural gas, NGLs, crude oil and condensate we sell, and (ii) the costs associated with conducting our operations, including the costs of wellhead natural gas, crude oil and mixed NGLs that we purchase as well as operating, general and administrative costs and the impact of our commodity hedging activities. Because commodity price movements tend to impact both revenues and costs, increases or decreases in our revenues alone are not necessarily indicative of increases or decreases in our profitability. Our contract portfolio, the prevailing pricing environment for crude oil, natural gas and NGLs, the impact of our commodity hedging program and its ability to mitigate exposure to commodity price movements and the volumes of crude oil, natural gas and NGL throughput on our systems are important factors in determining our profitability. Our profitability is also affected by the NGL content in gathered wellhead natural gas, supply and demand for our products and services, utilization of our assets and changes in our customer mix.
Our profitability is also impacted by fee-based contracts. Our growing capital expenditures for pipelines and gathering and processing assets underpinned by fee-based margin, expansion of our downstream facilities, continued focus on adding fee-based margin to our existing and future gathering and processing contracts, as well as third-party acquisitions of businesses and assets, will continue to increase the number of our contracts that are fee-based. Fixed fees for services such as gathering and processing, transportation, fractionation, storage, terminaling and crude oil gathering are not directly tied to changes in market prices for commodities. Nevertheless, a change in market dynamics such as available commodity throughput does affect profitability.
Management uses a variety of financial measures and operational measurements to analyze our performance. These include: (1) throughput volumes, facility efficiencies and fuel consumption, (2) operating expenses, (3) capital expenditures and (4) the following non-GAAP measures: gross margin, operating margin, and Adjusted EBITDA.
Throughput Volumes, Facility Efficiencies and Fuel Consumption
Our profitability is impacted by our ability to add new sources of natural gas supply and crude oil supply to offset the natural decline of existing volumes from oil and natural gas wells that are connected to our gathering and processing systems. This is achieved by connecting new wells and adding new volumes in existing areas of production, as well as by capturing crude oil and natural gas supplies currently gathered by third parties. Similarly, our profitability is impacted by our ability to add new sources of mixed NGL supply, connected by third-party transportation and Grand Prix, to our Downstream Business fractionation facilities and at times to our export facilities. We fractionate NGLs generated by our gathering and processing plants, as well as by contracting for mixed NGL supply from third-party facilities.
In addition, we seek to increase operating margin by limiting volume losses, reducing fuel consumption and by increasing efficiency. With our gathering systems’ extensive use of remote monitoring capabilities, we monitor the volumes received at the wellhead or central delivery points along our gathering systems, the volume of natural gas received at our processing plant inlets and the volumes of NGLs and residue natural gas recovered by our processing plants. We also monitor the volumes of NGLs received, stored, fractionated and delivered across our logistics assets. This information is tracked through our processing plants and Downstream Business facilities to determine customer settlements for sales and volume related fees for service and helps us increase efficiency and reduce fuel consumption.
58
As part of monitoring the efficiency of our operations, we measure the difference between the volume of natural gas received at the wellhead or central delivery points on our gathering systems and the volume received at the inlet of our processing plants as an indicator of fuel consumption and line loss. We also track the difference between the volume of natural gas received at the inlet of the processing plant and the NGLs and residue gas produced at the outlet of such plant to monitor the fuel consumption and recoveries of our facilities. Similar tracking is performed for our crude oil gathering and logistics assets and our NGL pipelines. These volume, recovery and fuel consumption measurements are an important part of our operational efficiency analysis and safety programs.
Operating Expenses
Operating expenses are costs associated with the operation of specific assets. Labor, contract services, repair and maintenance, utilities and ad valorem taxes comprise the most significant portion of our operating expenses. These expenses, other than fuel and power, remain relatively stable and independent of the volumes through our systems, but may increase with system expansions and will fluctuate depending on the scope of the activities performed during a specific period.
Capital Expenditures
Our capital expenditures are classified as growth capital expenditures, business acquisitions, and maintenance capital expenditures. Growth capital expenditures improve the service capability of the existing assets, extend asset useful lives, increase capacities from existing levels, add capabilities, and reduce costs or enhance revenues. Maintenance capital expenditures are those expenditures that are necessary to maintain the service capability of our existing assets, including the replacement of system components and equipment, which are worn, obsolete or completing their useful life and expenditures to remain in compliance with environmental laws and regulations.
Capital projects associated with growth and maintenance projects are closely monitored. Return on investment is analyzed before a capital project is approved, spending is closely monitored throughout the development of the project, and the subsequent operational performance is compared to the assumptions used in the economic analysis performed for the capital investment approval.
Non-GAAP Measures
We utilize non-GAAP measures to analyze our performance. Gross margin, operating margin and Adjusted EBITDA are non-GAAP measures. The GAAP measure most directly comparable to these non-GAAP measures is net income (loss) attributable to TRP. These non-GAAP measures should not be considered as an alternative to GAAP net income attributable to TRP and have important limitations as analytical tools. Investors should not consider these measures in isolation or as a substitute for analysis of our results as reported under GAAP. Additionally, because our non-GAAP measures exclude some, but not all, items that affect net income, and are defined differently by different companies within our industry, our definitions may not be comparable with similarly titled measures of other companies, thereby diminishing their utility. Management compensates for the limitations of our non-GAAP measures as analytical tools by reviewing the comparable GAAP measures, understanding the differences between the measures and incorporating these insights into our decision-making processes.
Gross Margin
We define gross margin as revenues less product purchases. It is impacted by volumes and commodity prices as well as by our contract mix and commodity hedging program.
Gathering and Processing segment gross margin consists primarily of:
|
|
• |
service fees related to natural gas and crude oil gathering, treating and processing; and |
|
|
• |
revenues from the sale of natural gas, condensate, crude oil and NGLs less producer payments, natural gas and crude oil purchases, and our equity volume hedge settlements. |
Logistics and Transportation segment gross margin consists primarily of:
|
|
• |
service fees (including the pass-through of energy costs included in fee rates); |
|
|
• |
system product gains and losses; and |
|
|
• |
NGL and natural gas sales, less NGL and natural gas purchases, third-party transportation costs and the net inventory change. |
The gross margin impacts of mark-to-market hedge unrealized changes in fair value are reported in Other.
59
Operating Margin
We define operating margin as gross margin less operating expenses. Operating margin is an important performance measure of the core profitability of our operations.
Management reviews business segment gross margin and operating margin monthly as a core internal management process. We believe that investors benefit from having access to the same financial measures that management uses in evaluating our operating results. Gross margin and operating margin provide useful information to investors because they are used as supplemental financial measures by management and by external users of our financial statements, including investors and commercial banks, to assess:
|
|
• |
the financial performance of our assets without regard to financing methods, capital structure or historical cost basis; |
|
|
• |
our operating performance and return on capital as compared to other companies in the midstream energy sector, without regard to financing or capital structure; and |
|
|
• |
the viability of capital expenditure projects and acquisitions and the overall rates of return on alternative investment opportunities. |
Adjusted EBITDA
We define Adjusted EBITDA as net income (loss) attributable to TRP before interest, income taxes, depreciation and amortization, and other items that we believe should be adjusted consistent with our core operating performance. The adjusting items are detailed in the Adjusted EBITDA reconciliation table and its footnotes. Adjusted EBITDA is used as a supplemental financial measure by us and by external users of our financial statements such as investors, commercial banks and others to measure the ability of our assets to generate cash sufficient to pay interest costs, support our indebtedness and make distributions to holders of our equity interests.
Our Non-GAAP Financial Measures
The following tables reconcile the non-GAAP financial measures used by management to the most directly comparable GAAP measures for the periods indicated.
|
|
|
Year Ended December 31, |
|
|||||
|
|
|
2020 |
|
|
2019 |
|
||
|
|
|
(In millions) |
|
|||||
|
Reconciliation of Net Income (Loss) to Operating Margin and Gross Margin |
|
|
|
|
|
|
|
|
|
Net income (loss) |
|
$ |
(1,545.1 |
) |
|
$ |
(15.6 |
) |
|
Depreciation and amortization expense |
|
|
865.1 |
|
|
|
971.7 |
|
|
General and administrative expense |
|
|
242.2 |
|
|
|
267.5 |
|
|
Impairment of long-lived assets |
|
|
2,442.8 |
|
|
|
225.3 |
|
|
Interest (income) expense, net |
|
|
378.8 |
|
|
|
320.8 |
|
|
Equity (earnings) loss |
|
|
(72.6 |
) |
|
|
(39.0 |
) |
|
Income tax expense (benefit) |
|
|
(3.5 |
) |
|
|
(0.9 |
) |
|
(Gain) loss on sale or disposition of business and assets |
|
|
58.4 |
|
|
|
71.1 |
|
|
Write-down of assets |
|
|
55.6 |
|
|
|
17.9 |
|
|
(Gain) loss from sale of equity-method investment |
|
|
— |
|
|
|
(69.3 |
) |
|
(Gain) loss from financing activities |
|
|
(45.6 |
) |
|
|
1.4 |
|
|
Change in contingent considerations |
|
|
(0.3 |
) |
|
|
8.7 |
|
|
Other, net |
|
|
(0.4 |
) |
|
|
0.2 |
|
|
Operating margin |
|
$ |
2,375.4 |
|
|
$ |
1,759.8 |
|
|
Operating expenses |
|
|
779.8 |
|
|
|
792.8 |
|
|
Gross margin |
|
$ |
3,155.2 |
|
|
$ |
2,552.6 |
|
60
|
|
|
Year Ended December 31, |
|
|||||
|
|
|
2020 |
|
|
2019 |
|
||
|
|
|
(In millions) |
|
|||||
|
Reconciliation of Net Income (Loss) attributable to TRP to Adjusted EBITDA |
|
|
|
|
|
|
|
|
|
Net income (loss) attributable to TRP |
|
$ |
(1,758.8 |
) |
|
$ |
(254.7 |
) |
|
Interest (income) expense, net |
|
|
378.8 |
|
|
|
320.8 |
|
|
Income tax expense (benefit) |
|
|
(3.5 |
) |
|
|
(0.9 |
) |
|
Depreciation and amortization expense |
|
|
865.1 |
|
|
|
971.7 |
|
|
Impairment of long-lived assets |
|
|
2,442.8 |
|
|
|
225.3 |
|
|
(Gain) loss on sale or disposition of business and assets |
|
|
58.4 |
|
|
|
71.1 |
|
|
Write-down of assets |
|
|
55.6 |
|
|
|
17.9 |
|
|
(Gain) loss from sale of equity-method investment |
|
|
— |
|
|
|
(69.3 |
) |
|
(Gain) loss from financing activities (1) |
|
|
(45.6 |
) |
|
|
1.4 |
|
|
Equity (earnings) loss |
|
|
(72.6 |
) |
|
|
(39.0 |
) |
|
Distributions from unconsolidated affiliates and preferred partner interests, net |
|
|
108.6 |
|
|
|
61.2 |
|
|
Change in contingent considerations |
|
|
(0.3 |
) |
|
|
8.7 |
|
|
Risk management activities |
|
|
(228.2 |
) |
|
|
112.8 |
|
|
Severance and related benefits (2) |
|
|
6.5 |
|
|
|
— |
|
|
Noncontrolling interests adjustments (3) |
|
|
(224.3 |
) |
|
|
(38.5 |
) |
|
TRP Adjusted EBITDA |
|
$ |
1,582.5 |
|
|
$ |
1,388.5 |
|
|
(1) |
Gains or losses on debt repurchases or early debt extinguishments. |
|
(2) |
Represents one-time severance and related benefit expense related to our cost reduction measures. |
|
(3) |
Noncontrolling interest portion of depreciation and amortization expense (including the effects of the impairment of long-lived assets on non-controlling interests). |
Consolidated Results of Operations
The following table and discussion is a summary of our consolidated results of operations:
|
|
|
Year Ended December 31, |
|
|
|
|
|
|
|
|
|
|||||
|
|
|
2020 |
|
|
2019 |
|
|
2020 vs. 2019 |
|
|||||||
|
|
|
(In millions) |
|
|||||||||||||
|
Revenues: |
|
|
|
|
|
|
|
|
|
|
|
|
|
|
|
|
|
Sales of commodities |
|
$ |
7,171.0 |
|
|
$ |
7,393.8 |
|
|
$ |
(222.8 |
) |
|
|
(3 |
%) |
|
Fees from midstream services |
|
|
1,089.3 |
|
|
|
1,277.3 |
|
|
|
(188.0 |
) |
|
|
(15 |
%) |
|
Total revenues |
|
|
8,260.3 |
|
|
|
8,671.1 |
|
|
|
(410.8 |
) |
|
|
(5 |
%) |
|
Product purchases |
|
|
5,105.1 |
|
|
|
6,118.5 |
|
|
|
(1,013.4 |
) |
|
|
(17 |
%) |
|
Gross margin (1) |
|
|
3,155.2 |
|
|
|
2,552.6 |
|
|
|
602.6 |
|
|
|
24 |
% |
|
Operating expenses |
|
|
779.8 |
|
|
|
792.8 |
|
|
|
(13.0 |
) |
|
|
(2 |
%) |
|
Operating margin (1) |
|
|
2,375.4 |
|
|
|
1,759.8 |
|
|
|
615.6 |
|
|
|
35 |
% |
|
Depreciation and amortization expense |
|
|
865.1 |
|
|
|
971.7 |
|
|
|
(106.6 |
) |
|
|
(11 |
%) |
|
General and administrative expense |
|
|
242.2 |
|
|
|
267.5 |
|
|
|
(25.3 |
) |
|
|
(9 |
%) |
|
Impairment of long-lived assets |
|
|
2,442.8 |
|
|
|
225.3 |
|
|
|
2,217.5 |
|
|
NM |
|
|
|
Other operating (income) expense |
|
|
116.6 |
|
|
|
89.2 |
|
|
|
27.4 |
|
|
|
31 |
% |
|
Income (loss) from operations |
|
|
(1,291.3 |
) |
|
|
206.1 |
|
|
|
(1,497.4 |
) |
|
NM |
|
|
|
Interest expense, net |
|
|
(378.8 |
) |
|
|
(320.8 |
) |
|
|
(58.0 |
) |
|
|
18 |
% |
|
Equity earnings (loss) |
|
|
72.6 |
|
|
|
39.0 |
|
|
|
33.6 |
|
|
|
86 |
% |
|
Gain (loss) from financing activities |
|
|
45.6 |
|
|
|
(1.4 |
) |
|
|
47.0 |
|
|
NM |
|
|
|
Gain (loss) from sale of equity-method investment |
|
|
— |
|
|
|
69.3 |
|
|
|
(69.3 |
) |
|
|
(100 |
%) |
|
Change in contingent considerations |
|
|
0.3 |
|
|
|
(8.7 |
) |
|
|
9.0 |
|
|
|
103 |
% |
|
Other, net |
|
|
3.0 |
|
|
|
— |
|
|
|
3.0 |
|
|
|
— |
|
|
Income tax (expense) benefit |
|
|
3.5 |
|
|
|
0.9 |
|
|
|
2.6 |
|
|
|
289 |
% |
|
Net income (loss) |
|
|
(1,545.1 |
) |
|
|
(15.6 |
) |
|
|
(1,529.5 |
) |
|
NM |
|
|
|
Less: Net income (loss) attributable to noncontrolling interests |
|
|
213.7 |
|
|
|
239.1 |
|
|
|
(25.4 |
) |
|
|
(11 |
%) |
|
Net income (loss) attributable to Targa Resources Partners LP |
|
$ |
(1,758.8 |
) |
|
$ |
(254.7 |
) |
|
$ |
(1,504.1 |
) |
|
NM |
|
|
|
Financial data: |
|
|
|
|
|
|
|
|
|
|
|
|
|
|
|
|
|
Adjusted EBITDA (1) |
|
$ |
1,582.5 |
|
|
$ |
1,388.5 |
|
|
$ |
194.0 |
|
|
|
14 |
% |
________________
|
(1) |
Gross margin, operating margin, and Adjusted EBITDA are non-GAAP financial measures and are discussed under “Management’s Discussion and Analysis of Financial Condition and Results of Operations–How We Evaluate Our Operations.” |
|
NM |
Due to a low denominator, the noted percentage change is disproportionately high and as a result, considered not meaningful. |
61
2020 Compared to 2019
The decrease in sales of commodities reflects lower NGL, condensate, petroleum product and natural gas prices ($945.1 million) and lower crude marketing and petroleum product volumes ($397.1 million), partially offset by higher NGL, natural gas, and condensate volumes ($816.3 million) and the favorable impact of hedges ($301.1 million).
The decrease in fees from midstream services is primarily due to new commercial arrangements for volumes effective in January 2020, which resulted in a change from net presentation as fees from midstream services to gross presentation as sales of commodities and product purchases, partially offset by increased export and terminaling and storage volumes.
The decrease in product purchases reflects lower NGL, condensate, petroleum product and natural gas prices, lower crude marketing volumes associated with the sale of the Delaware crude system, which was effective December 1, 2019, and lower petroleum products volumes, partially offset by higher NGL, natural gas and condensate volumes.
Higher operating margin and gross margin in 2020 reflect increased segment results for both Gathering and Processing and Logistics and Transportation. See “—Results of Operations—By Reportable Segment” for additional information regarding changes in operating margin and gross margin on a segment basis.
Depreciation and amortization expense decreased primarily due to a lower depreciable base associated with assets that were impaired during 2020 and the sale of the Delaware crude system, which was effective December 1, 2019. The decrease in depreciation and amortization expense was partially offset by depreciation related to major growth capital projects placed in service, including Train 7 in the first quarter of 2020, the additional processing plants and associated infrastructure in the Permian Basin and a full year of depreciation related to Grand Prix, which was placed in service in the third quarter of 2019.
General and administrative expense decreased due to cost reduction measures resulting in lower compensation and benefits and non-labor expenses, partially offset by an increase in insurance costs.
We recognized non-cash pre-tax impairment charges of $2,442.8 million and $225.3 million during 2020 and 2019. The non-cash pre-tax impairment charge in 2020 is primarily associated with the partial impairment of certain gas processing facilities and gathering systems associated with our Central operations and full impairment of our Coastal operations. The non-cash pre-tax impairment charge in 2019 is primarily associated with the partial impairment of certain gas processing facilities and gathering systems associated with our Central and Coastal operations.
Other operating (income) expense in 2020 consisted primarily of a loss associated with the sale of our assets in Channelview, Texas and write-down of certain assets to their recoverable amounts. Other operating (income) expense in 2019 consisted primarily of a loss associated with the sale of our Delaware crude system, which was effective December 1, 2019, and write-down of certain assets to their recoverable amounts.
Interest expense, net, increased due to lower capitalized interest resulting from lower growth capital investments and higher average borrowings.
The increase in equity earnings is primarily due to higher earnings from our investments in GCX and Little Missouri 4, partially offset by lower earnings from GCF.
During 2020, we repurchased a portion of our outstanding senior notes on the open market and redeemed the 6¾% Senior Notes due 2024 and the 5¼% Senior Notes due 2023, resulting in a $45.6 million net gain from financing activities. During 2019, we redeemed the 4⅛% Senior Notes due 2019, resulting in $1.4 million loss from financing activities.
During 2019, we closed on the sale of an equity-method investment that resulted in a gain of $69.3 million.
The increase in income tax benefit is primarily due to a higher pre-tax book loss, partially offset by a valuation allowance in 2020.
Net income attributable to noncontrolling interests was lower in 2020 primarily due to the allocation of non-cash pre-tax impairment losses recognized during the first quarter of 2020, partially offset by increased earnings allocated to interests holders in the DevCo Joint Ventures, Targa Badlands and Grand Prix.
62
Results of Operations—By Reportable Segment
Our operating margins by reportable segment are:
|
|
|
Gathering and Processing |
|
|
|
Logistics and Transportation |
|
|
|
Other |
|
|
|
Consolidated Operating Margin |
|
||||
|
|
|
(In millions) |
|
||||||||||||||||
|
December 31, 2020 |
|
$ |
1,017.7 |
|
|
|
$ |
1,128.0 |
|
|
|
$ |
229.7 |
|
|
|
$ |
2,375.4 |
|
|
December 31, 2019 |
|
|
1,006.5 |
|
|
|
|
867.2 |
|
|
|
|
(113.9 |
) |
|
|
|
1,759.8 |
|
Gathering and Processing Segment
|
|
Year Ended December 31, |
|
|
|
|
|
|
|
|
|
|
|||||||
|
|
2020 |
|
|
2019 |
|
|
2020 vs. 2019 |
|
||||||||||
|
|
(In millions, except operating statistics and price amounts) |
|
||||||||||||||||
|
Gross margin |
$ |
|
1,450.3 |
|
|
$ |
|
1,496.0 |
|
|
$ |
|
(45.7 |
) |
|
|
(3 |
%) |
|
Operating expenses |
|
|
432.6 |
|
|
|
|
489.6 |
|
|
|
|
(57.0 |
) |
|
|
(12 |
%) |
|
Operating margin |
$ |
|
1,017.7 |
|
|
$ |
|
1,006.4 |
|
|
$ |
|
11.3 |
|
|
|
1 |
% |
|
Operating statistics (1): |
|
|
|
|
|
|
|
|
|
|
|
|
|
|
|
|
|
|
|
Plant natural gas inlet, MMcf/d (2),(3) |
|
|
|
|
|
|
|
|
|
|
|
|
|
|
|
|
|
|
|
Permian Midland (4) |
|
|
1,745.6 |
|
|
|
|
1,471.6 |
|
|
|
|
274.0 |
|
|
|
19 |
% |
|
Permian Delaware |
|
|
729.4 |
|
|
|
|
599.7 |
|
|
|
|
129.7 |
|
|
|
22 |
% |
|
Total Permian |
|
|
2,475.0 |
|
|
|
|
2,071.3 |
|
|
|
|
403.7 |
|
|
|
|
|
|
|
|
|
|
|
|
|
|
|
|
|
|
|
|
|
|
|
|
|
|
SouthTX (5) |
|
|
248.1 |
|
|
|
|
321.2 |
|
|
|
|
(73.1 |
) |
|
|
(23 |
%) |
|
North Texas |
|
|
201.6 |
|
|
|
|
226.9 |
|
|
|
|
(25.3 |
) |
|
|
(11 |
%) |
|
SouthOK (6) |
|
|
443.0 |
|
|
|
|
606.1 |
|
|
|
|
(163.1 |
) |
|
|
(27 |
%) |
|
WestOK |
|
|
249.5 |
|
|
|
|
330.2 |
|
|
|
|
(80.7 |
) |
|
|
(24 |
%) |
|
Total Central |
|
|
1,142.2 |
|
|
|
|
1,484.4 |
|
|
|
|
(342.2 |
) |
|
|
|
|
|
|
|
|
|
|
|
|
|
|
|
|
|
|
|
|
|
|
|
|
|
Badlands (7),(8) |
|
|
137.8 |
|
|
|
|
116.7 |
|
|
|
|
21.1 |
|
|
|
18 |
% |
|
Total Field |
|
|
3,755.0 |
|
|
|
|
3,672.4 |
|
|
|
|
82.6 |
|
|
|
|
|
|
|
|
|
|
|
|
|
|
|
|
|
|
|
|
|
|
|
|
|
|
Coastal |
|
|
643.3 |
|
|
|
|
774.2 |
|
|
|
|
(130.9 |
) |
|
|
(17 |
%) |
|
|
|
|
|
|
|
|
|
|
|
|
|
|
|
|
|
|
|
|
|
Total |
|
|
4,398.3 |
|
|
|
|
4,446.6 |
|
|
|
|
(48.3 |
) |
|
|
(1 |
%) |
|
NGL production, MBbl/d (3) |
|
|
|
|
|
|
|
|
|
|
|
|
|
|
|
|
|
|
|
Permian Midland (4) |
|
|
250.8 |
|
|
|
|
209.1 |
|
|
|
|
41.7 |
|
|
|
20 |
% |
|
Permian Delaware |
|
|
99.1 |
|
|
|
|
78.6 |
|
|
|
|
20.5 |
|
|
|
26 |
% |
|
Total Permian |
|
|
349.9 |
|
|
|
|
287.7 |
|
|
|
|
62.2 |
|
|
|
|
|
|
|
|
|
|
|
|
|
|
|
|
|
|
|
|
|
|
|
|
|
|
SouthTX (5) |
|
|
26.1 |
|
|
|
|
41.6 |
|
|
|
|
(15.5 |
) |
|
|
(37 |
%) |
|
North Texas |
|
|
23.9 |
|
|
|
|
26.8 |
|
|
|
|
(2.9 |
) |
|
|
(11 |
%) |
|
SouthOK (6) |
|
|
52.4 |
|
|
|
|
67.1 |
|
|
|
|
(14.7 |
) |
|
|
(22 |
%) |
|
WestOK |
|
|
20.3 |
|
|
|
|
21.6 |
|
|
|
|
(1.3 |
) |
|
|
(6 |
%) |
|
Total Central |
|
|
122.7 |
|
|
|
|
157.1 |
|
|
|
|
(34.4 |
) |
|
|
|
|
|
|
|
|
|
|
|
|
|
|
|
|
|
|
|
|
|
|
|
|
|
Badlands (8) |
|
|
16.3 |
|
|
|
|
13.8 |
|
|
|
|
2.5 |
|
|
|
18 |
% |
|
Total Field |
|
|
488.9 |
|
|
|
|
458.6 |
|
|
|
|
30.3 |
|
|
|
|
|
|
|
|
|
|
|
|
|
|
|
|
|
|
|
|
|
|
|
|
|
|
Coastal |
|
|
40.0 |
|
|
|
|
46.8 |
|
|
|
|
(6.8 |
) |
|
|
(15 |
%) |
|
|
|
|
|
|
|
|
|
|
|
|
|
|
|
|
|
|
|
|
|
Total |
|
|
528.9 |
|
|
|
|
505.4 |
|
|
|
|
23.5 |
|
|
|
5 |
% |
|
Crude oil, Badlands, MBbl/d |
|
|
156.5 |
|
|
|
|
172.6 |
|
|
|
|
(16.1 |
) |
|
|
(9 |
%) |
|
Crude oil, Permian, MBbl/d (9) |
|
|
43.3 |
|
|
|
|
83.3 |
|
|
|
|
(40.0 |
) |
|
|
(48 |
%) |
|
Natural gas sales, BBtu/d (3),(10) |
|
|
2,094.8 |
|
|
|
|
2,020.6 |
|
|
|
|
74.2 |
|
|
|
4 |
% |
|
NGL sales, MBbl/d (3),(10) |
|
|
399.5 |
|
|
|
|
391.9 |
|
|
|
|
7.6 |
|
|
|
2 |
% |
|
Condensate sales, MBbl/d |
|
|
15.5 |
|
|
|
|
12.3 |
|
|
|
|
3.2 |
|
|
|
26 |
% |
|
Average realized prices - inclusive of hedges (11): |
|
|
|
|
|
|
|
|
|
|
|
|
|
|
|
|
|
|
|
Natural gas, $/MMBtu |
|
|
1.27 |
|
|
|
|
1.35 |
|
|
|
|
(0.08 |
) |
|
|
(6 |
%) |
|
NGL, $/gal |
|
|
0.26 |
|
|
|
|
0.34 |
|
|
|
|
(0.08 |
) |
|
|
(24 |
%) |
|
Condensate, $/Bbl |
|
|
39.40 |
|
|
|
|
49.99 |
|
|
|
|
(10.59 |
) |
|
|
(21 |
%) |
63
________________
|
(1) |
Segment operating statistics include the effect of intersegment amounts, which have been eliminated from the consolidated presentation. For all volume statistics presented, the numerator is the total volume sold during the year and the denominator is the number of calendar days during the year. |
|
(2) |
Plant natural gas inlet represents our undivided interest in the volume of natural gas passing through the meter located at the inlet of a natural gas processing plant, other than Badlands. |
|
(3) |
Plant natural gas inlet volumes and gross NGL production volumes include producer take-in-kind volumes, while natural gas sales and NGL sales exclude producer take-in-kind volumes. |
|
(4) |
Permian Midland includes operations in WestTX, of which we own 72.8%, and other plants that are owned 100% by us. Operating results for the WestTX undivided interest assets are presented on a pro-rata net basis in our reported financials. |
|
(5) |
SouthTX includes the Raptor Plant, of which we own a 50% interest through the Carnero Joint Venture. The Carnero Joint Venture is a consolidated subsidiary and its financial results are presented on a gross basis in our reported financials. |
|
(6) |
SouthOK includes the Centrahoma Joint Venture, of which we own 60%, and other plants that are owned 100% by us. Centrahoma is a consolidated subsidiary and its financial results are presented on a gross basis in our reported financials. |
|
(7) |
Badlands natural gas inlet represents the total wellhead volume, and includes the Targa volumes processed at the LM4 Plant. |
|
(8) |
As of April 3, 2019, Targa owns 55% of Targa Badlands, prior to which we owned a 100% interest. Targa Badlands is a consolidated subsidiary and its financial results are presented on a gross basis in our reported financials. |
|
(9) |
Permian crude oil volumes reflect the sale of the Delaware crude system, which was effective December 1, 2019. |
|
(10) |
Natural gas and NGL sales statistics in 2020 include statistics related to new commercial arrangements effective in January 2020, which resulted in a change from net presentation as “Fees from midstream services” to gross presentation as “Sales of commodities” and “Product purchases”. This change in presentation did not result in an impact to our operating or gross margin. |
|
(11) |
Average realized prices include the effect of realized commodity hedge gain/loss attributable to our equity volumes, previously shown in Other. The price is calculated using total commodity sales plus the hedge gain/loss as the numerator and total sales volume as the denominator. |
The following table presents the realized commodity hedge gain/loss attributable to our equity volumes that are included in the gross margin of Gathering and Processing segment:
|
|
|
Year Ended December 31, 2020 |
|
|
Year Ended December 31, 2019 |
|
||||||||||||||||||
|
|
|
(In millions, except volumetric data and price amounts) |
|
|||||||||||||||||||||
|
|
|
Volume Settled |
|
|
Price Spread (1) |
|
|
Gain (Loss) |
|
|
Volume Settled |
|
|
Price Spread (1) |
|
|
Gain (Loss) |
|
||||||
|
Natural gas (BBtu) |
|
|
68.1 |
|
|
$ |
0.37 |
|
|
$ |
25.1 |
|
|
|
62.9 |
|
|
$ |
1.17 |
|
|
$ |
73.7 |
|
|
NGL (MMgal) |
|
|
451.4 |
|
|
|
0.12 |
|
|
|
53.3 |
|
|
|
369.7 |
|
|
|
0.10 |
|
|
|
38.0 |
|
|
Crude oil (MBbl) |
|
|
1.9 |
|
|
|
18.54 |
|
|
|
34.9 |
|
|
|
1.5 |
|
|
|
(2.29 |
) |
|
|
(3.5 |
) |
|
|
|
|
|
|
|
|
|
|
|
$ |
113.3 |
|
|
|
|
|
|
|
|
|
|
$ |
108.2 |
|
________________
|
(1) |
The price spread is the differential between the contracted derivative instrument pricing and the price of the corresponding settled commodity transaction. |
2020 Compared to 2019
During the year ended December 31, 2020, the COVID-19 pandemic reduced economic activity and the related demand for energy commodities, which contributed to weak commodity prices compared to historical levels and price volatility. The drop in commodity prices also resulted in prompt reactions from some domestic producers, including significantly reducing capital budgets and resultant drilling activity and shutting-in production, particularly during the second quarter.
The resulting decrease in Gathering and Processing segment gross margin was primarily due to lower Central region volumes and lower commodity prices, partially offset by higher inlet volumes and fee-based margin in the Permian region and the Badlands and higher realized hedge gains. Lower volumes in the Central region were attributable to reduced producer activity and temporary shut-ins. In the Permian, inlet volumes and NGL production increased due to production from new wells and the addition of the Hopson, Pembrook and Falcon plants in 2019 and the Peregrine and Gateway plants in 2020. In the Badlands, natural gas purchased volumes and NGL production increased due to production from new wells and the incremental processing capacity available with the commencement of operations at the Little Missouri 4 Plant in the third quarter of 2019. In the Coastal region, volumes were lower due to continued low producer activity and the effects of multiple Gulf Coast hurricanes in the third and fourth quarters of 2020, which necessitated temporary shut downs of certain facilities. Total crude oil volumes decreased in the Badlands due to reduced producer activity and temporary shut-ins, while the decrease in the Permian was primarily due to the sale of the Delaware crude system in the fourth quarter of 2019.
Operating expenses were lower due to cost reduction measures implemented in response to the impact of the COVID-19 pandemic on our business, which resulted in decreases in contract labor, chemicals and compressor rentals, despite the addition of the Peregrine and Gateway processing facilities in the Permian.
64
Logistics and Transportation Segment
|
|
|
Year Ended December 31, |
|
|
|
|
|
||||||||||||
|
|
|
2020 |
|
|
2019 |
|
|
2020 vs. 2019 |
|
||||||||||
|
|
(In millions, except operating statistics and price amounts) |
|
|||||||||||||||||
|
Gross margin |
|
$ |
|
1,480.7 |
|
|
$ |
|
1,173.9 |
|
|
$ |
|
306.8 |
|
|
26% |
|
|
|
Operating expenses (1) |
|
|
|
352.7 |
|
|
|
|
306.7 |
|
|
|
|
46.0 |
|
|
15% |
|
|
|
Operating margin |
|
$ |
|
1,128.0 |
|
|
$ |
|
867.2 |
|
|
$ |
|
260.8 |
|
|
30% |
|
|
|
Operating statistics MBbl/d (2): |
|
|
|
|
|
|
|
|
|
|
|
|
|
|
|
|
|
|
|
|
Fractionation volumes (3) |
|
|
|
602.9 |
|
|
|
|
519.0 |
|
|
|
|
83.9 |
|
|
16% |
|
|
|
Export volumes (4) |
|
|
|
300.4 |
|
|
|
|
237.9 |
|
|
|
|
62.5 |
|
|
26% |
|
|
|
Pipeline throughput (5) |
|
|
|
293.7 |
|
|
|
|
100.4 |
|
|
|
|
193.3 |
|
|
NM |
|
|
|
NGL sales |
|
|
|
752.5 |
|
|
|
|
651.0 |
|
|
|
|
101.5 |
|
|
16% |
|
|
|
(1) |
Effective January 1, 2020, pursuant to amendments to contractual arrangements with our partners, our share of operating expenses associated with GCF, an investment in an unconsolidated affiliate, are included in operating expenses. |
|
(2) |
Segment operating statistics include intersegment amounts, which have been eliminated from the consolidated presentation. For all volume statistics presented, the numerator is the total volume sold during the year and the denominator is the number of calendar days during the year. |
|
(3) |
Fractionation contracts include pricing terms composed of base fees and fuel and power components that vary with the cost of energy. As such, the Logistics and Transportation segment results include effects of variable energy costs that impact both gross margin and operating expenses. |
|
(4) |
Export volumes represent the quantity of NGL products delivered to third-party customers at our Galena Park Marine Terminal that are destined for international markets. |
|
(5) |
Pipeline throughput represents the total quantity of mixed NGLs delivered by Grand Prix to Mont Belvieu. |
|
NM |
Due to a low denominator, the noted percentage change is disproportionately high and as a result, considered not meaningful. |
2020 Compared to 2019
The increase in Logistics and Transportation segment gross margin was driven by higher pipeline transportation, fractionation and LPG export system volumes from higher supply volumes from our Permian Gathering and Processing systems and associated downstream system expansions, partially offset by fewer optimization opportunities in our marketing businesses. NGL transportation and fractionation volumes increased due to higher volumes delivered on Grand Prix, which began full service into Mont Belvieu during the third quarter of 2019, and the commencement of operations of Train 6 in the second quarter of 2019, Train 7 in the first quarter of 2020 and Train 8 late in the third quarter of 2020.
Operating expenses were higher due to system expansions, including Grand Prix, fractionation capacity and expansion of our LPG export capabilities and our share of operating expenses associated with GCF and certain one-time maintenance expenses including hurricane damage repairs, partially offset by lower fuel and power costs and cost reduction measures.
Other
|
|
|
Year Ended December 31, |
|
|
|
|
|
|||||
|
|
|
2020 |
|
|
2019 |
|
|
2020 vs. 2019 |
|
|||
|
|
|
(In millions) |
|
|||||||||
|
Gross margin |
|
$ |
229.7 |
|
|
$ |
(113.9 |
) |
|
$ |
343.6 |
|
|
Operating margin |
|
$ |
229.7 |
|
|
$ |
(113.9 |
) |
|
$ |
343.6 |
|
Other contains the results of commodity derivative activity mark-to-market gains/losses related to derivative contracts that were not designated as cash flow hedges. We have entered into derivative instruments to hedge the commodity price associated with a portion of our future commodity purchases and sales and natural gas transportation basis risk within our Logistics and Transportation segment. See further details of our risk management program in “Item 7A. – Quantitative and Qualitative Disclosures About Market Risk.”
Liquidity and Capital Resources
As of December 31, 2020, inclusive of our consolidated joint venture accounts, we had $231.3 million of “Cash and cash equivalents,” on our Consolidated Balance Sheets. We believe our cash positions, our cash flows from operating activities and remaining borrowing capacity on our credit facility (discussed below in “Short-term Liquidity”) are adequate to allow us to manage our day-to-day cash requirements and anticipated obligations as discussed further below.
Our ability to finance our operations, including funding capital expenditures and acquisitions, meeting our indebtedness obligations, refinancing or repaying our indebtedness and meeting our collateral requirements, will depend on our ability to generate cash in the future. Our ability to generate cash is subject to a number of factors, some of which are beyond our control. These include commodity prices and ongoing efforts to manage operating costs and maintenance capital expenditures, as well as general economic, financial, competitive, legislative, regulatory and other factors. For additional discussion on recent factors impacting our liquidity and capital resources, please see “Recent Developments – Response to Current Market Conditions.”
65
Our main sources of liquidity and capital resources are internally generated cash flows from operations, contributions from TRC that are funded through TRC’s access to debt and equity markets, borrowings under the TRP Revolver and the Securitization Facility, and access to debt markets. We supplement these sources of liquidity with joint venture arrangements and proceeds from asset sales. For companies involved in hydrocarbon production, transportation and other oil and gas related services, the capital markets have experienced and may continue to experience volatility. Our exposure to adverse credit conditions includes our credit facility, cash investments, hedging abilities, customer performance risks and counterparty performance risks.
Short-term Liquidity
Our short-term liquidity as of February 12, 2021, was:
|
|
|
|
February 12, 2021 |
|
|
|
|
|
|
(In millions) |
|
|
|
Cash on hand (1) |
|
$ |
295.1 |
|
|
|
Total availability under the TRP Revolver |
|
|
2,200.0 |
|
|
|
Total availability under the Securitization Facility |
|
|
350.0 |
|
|
|
|
|
|
2,845.1 |
|
|
|
|
|
|
|
|
|
|
Less: |
Outstanding borrowings under the TRP Revolver |
|
|
— |
|
|
|
Outstanding borrowings under the Securitization Facility |
|
|
— |
|
|
|
Outstanding letters of credit under the TRP Revolver |
|
|
(89.2 |
) |
|
|
Total liquidity |
|
$ |
2,755.9 |
|
_________________________________
|
(1) |
Includes cash held in our consolidated joint venture accounts. |
Other potential capital resources associated with our existing arrangements include:
|
|
• |
Our right to request an additional $500 million in commitment increases under the TRP Revolver, subject to the terms therein. The TRP Revolver matures on June 29, 2023. |
A portion of our capital resources are allocated to letters of credit to satisfy certain counterparty credit requirements. These letters of credit reflect our non-investment grade status, as assigned to us by Moody’s and S&P. They also reflect certain counterparties’ views of our financial condition and ability to satisfy our performance obligations, as well as commodity prices and other factors.
Working Capital
Working capital is the amount by which current assets exceed current liabilities. On a consolidated basis, at the end of any given month, accounts receivable and payable tied to commodity sales and purchases are relatively balanced, with receivables from customers being offset by plant settlements payable to producers. The factors that typically cause overall variability in our reported total working capital are: (i) our cash position; (ii) liquids inventory levels and valuation, which we closely manage; (iii) changes in payables and accruals related to major growth capital projects; (iv) changes in the fair value of the current portion of derivative contracts; (v) monthly swings in borrowings under the Securitization Facility; and (vi) major structural changes in our asset base or business operations, such as certain organic growth capital projects and acquisitions or divestitures.
Working capital as of December 31, 2020 decreased $129.3 million compared to December 31, 2019. The decrease was primarily attributable to the reduction in held for sale assets as a result of the closing of the Delaware crude system sale, which was effective December 1, 2019, and an increase in the current liability position of our derivative contracts, partially offset by lower payables for capital expenditures.
Based on our anticipated levels of operations and absent any disruptive events, we believe that our internally generated cash flow, contributions from TRC, borrowings available under the TRP Revolver and the Securitization Facility and proceeds from debt offerings, as well as joint ventures and/or asset sales, should provide sufficient resources to finance our operations, capital expenditures, long-term debt obligations, collateral requirements and cash distributions to Targa for at least the next twelve months.
Long-term Financing
Our long-term financing consists of potentially raising funds through long-term debt obligations, the issuance of preferred units or joint venture arrangements.
In February 2018, we formed three development joint ventures (“DevCo JVs”) with investment vehicles affiliated with Stonepeak Infrastructure Partners (“Stonepeak”), which committed a maximum of approximately $960 million of capital to the DevCo JVs. As of December 31, 2020, total contributions from Stonepeak to the DevCo JVs were $911.6 million and are included in noncontrolling interests.
66
Additionally, we serve as operator of our consolidated subsidiary, Grand Prix Pipeline LLC (the “Grand Prix Joint Venture”), in which Blackstone Energy Partners (“Blackstone”) owns a 25% interest. As of December 31, 2020, total contributions from funds managed by Blackstone to the Grand Prix Joint Venture were $347.4 million and are included in noncontrolling interests.
In April 2019, we closed on the sale of a 45% interest in Targa Badlands to GSO for $1.6 billion in cash. Growth capital of Targa Badlands after the sale is funded on a pro rata ownership basis. Targa Badlands pays a minimum quarterly distribution (“MQD”) to GSO and Targa, with GSO having a priority right on such MQDs. Additionally, GSO’s capital contributions would have a liquidation preference upon a sale of Targa Badlands. Targa Badlands is a discrete entity and the assets and credit of Targa Badlands are not available to satisfy the debts and other obligations of Targa or its other subsidiaries. As of December 31, 2020, the contributions from GSO were $75.7 million for growth capital expenditures.
In the second quarter of 2019, Williams exercised its initial option to acquire a 20% equity interest in Train 7 and subsequently executed a joint venture agreement with us. Certain fractionation-related infrastructure for Train 7, including storage caverns and brine handling, was funded and is owned 100% by Targa. As of December 31, 2020, the contributions from Williams were $29.9 million.
From time to time, we issue long-term debt securities, which we refer to as senior notes. Our senior notes issued to date, generally have similar terms other than interest rates, maturity dates and redemption premiums. As of December 31, 2020 and December 31, 2019, the aggregate principal amount outstanding of our senior notes and other various long-term debt obligations including unamortized premiums, debt issuance costs and non-current liabilities of finance leases, was $6,832.1 million and $7,005.2 million.
The majority of our debt is fixed rate borrowings; however, we have some exposure to the risk of changes in interest rates, primarily as a result of the variable rate borrowings under the TRP Revolver and the Securitization Facility. We may enter into interest rate hedges with the intent to mitigate the impact of changes in interest rates on cash flows. As of December 31, 2020, we did not have any interest rate hedges.
We may retire or purchase various series of our outstanding debt through cash purchases and/or exchanges for other debt, in open market purchases, privately negotiated transactions or otherwise. Such repurchases or exchanges, if any, will depend on prevailing market conditions, our liquidity requirements, contractual restrictions and other factors. The amounts involved may be material.
To date, our debt balances and our subsidiaries’ debt balances have not adversely affected our operations, ability to grow or ability to repay or refinance indebtedness. For additional information about our debt-related transactions, see Note 8 - Debt Obligations to our consolidated financial statements. For information about our interest rate risk, see “Item 7A. Quantitative and Qualitative Disclosures About Market Risk—Interest Rate Risk.”
In January 2019, we issued $750.0 million of 6½% Senior Notes due July 2027 and $750.0 million of 6⅞% Senior Notes due January 2029, resulting in total net proceeds of $1,486.6 million. The net proceeds from the issuance were used to redeem in full our outstanding 4⅛% Senior Notes due 2019 at par value plus accrued interest through the redemption date, with the remainder used for general partnership purposes, which included repayment of borrowings under the TRP Revolver.
In November 2019, we issued $1.0 billion aggregate principal amount of 5½% Senior Notes due March 2030, resulting in net proceeds of $990.8 million. The net proceeds from the issuance were used to repay borrowings under the TRP Revolver and for general partnership purposes.
During the first half of 2020, we repurchased a portion of our outstanding senior notes on the open market, paying $239.8 million plus accrued interest to repurchase $303.3 million of the notes. The repurchases resulted in a $61.1 million net gain, which included the write-off of $2.4 million in related debt issuance costs.
In August 2020, we issued $1.0 billion of 4⅞% Senior Notes due 2031, resulting in net proceeds of approximately $991 million. A portion of the net proceeds from the issuance were used to fund the August Tender Offer and redemption payments for the 6¾% Notes, with the remainder used for repayment of borrowings under the TRP Revolver.
We accepted for purchase all the notes that were validly tendered as of the early tender date, which totaled $262.1 million and redeemed the remaining aggregate principal amount of the 6¾% Notes, which totaled $318.0 million. We recorded a loss due to debt extinguishment of $13.7 million comprised of $11.1 million premiums paid and a write-off of $2.6 million of debt issuance costs. In November 2020, we redeemed the $559.6 million remaining balance of our 5¼% Senior Notes due 2023 with available liquidity under the TRP Revolver. As a result, we recorded a loss due to debt extinguishment of $1.8 million related to a write-off of debt issuance costs.
67
In February 2021, we issued $1.0 billion of 4% Senior Notes due 2032, resulting in net proceeds of approximately $992 million. A portion of the net proceeds from the issuance were used to fund the concurrent cash tender offer (the “January Tender Offer”) and subsequent redemption payment for our 5⅛% Senior Notes due 2025 (the “5⅛% Notes”), with the remainder used for repayment of borrowings under the TRP Revolver and the TRC Revolver.
Additionally, TPL issued notices of redemption for all of the outstanding TPL 4¾% Senior Notes due 2021 and TPL 5⅞% Senior Notes due 2023. These notes will be redeemed on February 22, 2021 with available liquidity under the TRP Revolver.
In December 2020, we redeemed all of our 5,000,000 issued and outstanding Preferred Units at a redemption price of $25.00 per unit, plus an amount equal to all unpaid distributions up to the date of redemption. The difference between the consideration paid (including unpaid distributions of $0.5 million) and the net carrying value of the units redeemed was $4.9 million, which was recorded as an increase to net income attributable to the preferred limited partners for the year ended December 31, 2020. The redemption of the Preferred Units is consistent with our ongoing efforts to simplify our capital structure and to identify opportunities to generate additional cash flow by enabling us to realize significant annual cash savings associated with the elimination of Preferred Unit distributions.
Compliance with Debt Covenants
As of December 31, 2020, we were in compliance with the covenants contained in our various debt agreements.
Cash Flow
Cash Flows from Operating Activities
|
2020 |
|
|
2019 |
|
|
2020 vs. 2019 |
|
|||
|
(In millions) |
|
|||||||||
|
$ |
1,702.9 |
|
|
$ |
1,363.0 |
|
|
$ |
339.9 |
|
The primary drivers of cash flows from operating activities are (i) the collection of cash from customers from the sale of NGLs, natural gas and other petroleum commodities, as well as fees for processing, gathering, export, fractionation, terminaling, storage and transportation, (ii) the payment of amounts related to the purchase of NGLs, natural gas and crude oil (iii) changes in payables and accruals related to major growth capital projects; and (iv) the payment of other expenses, primarily field operating costs, general and administrative expense and interest expense. In addition, we use derivative instruments to manage our exposure to commodity price risk. Changes in the prices of the commodities we hedge impact our derivative settlements as well as our margin deposit requirements on unsettled futures contracts.
Net cash provided by operations increased in 2020 compared to 2019 primarily due to higher operating margin, partially offset by an increase in interest payments as a result of higher average borrowings and lower cash received from settlement of hedging transactions.
Cash Flows from Investing Activities
|
2020 |
|
|
2019 |
|
|
2020 vs. 2019 |
|
|||
|
(In millions) |
|
|||||||||
|
$ |
(738.1 |
) |
|
$ |
(3,071.4 |
) |
|
$ |
2,333.3 |
|
Cash used in investing activities decreased in 2020 compared to 2019, primarily due to lower cash outlays for major growth capital projects of $1,925.7 million, resulting from the completion of construction of Grand Prix, Train 6, Train 7, and additional processing plants and associated infrastructure in the Permian Basin in 2019 and early 2020. The change is also attributable to proceeds of $134.1 million received from the sale of our Delaware crude system in 2020 and a $264.1 million decrease in our contributions to unconsolidated affiliates primarily due to the completion of GCX Pipeline in 2019.
68
Cash Flows from Financing Activities
|
|
2020 |
|
|
2019 |
|
||
|
|
(In millions) |
|
|||||
|
Source of Financing Activities, net |
|
|
|
|
|
|
|
|
Distributions |
$ |
(399.0 |
) |
|
$ |
(1,163.7 |
) |
|
Contributions from (distributions to) noncontrolling interests |
|
(397.7 |
) |
|
|
363.6 |
|
|
Debt, including financing costs |
|
(152.9 |
) |
|
|
1,104.4 |
|
|
Redemption of Preferred Units |
|
(125.0 |
) |
|
|
- |
|
|
Contributions from TRC and General Partner |
|
50.0 |
|
|
|
200.0 |
|
|
Sale of ownership interests in subsidiaries |
|
— |
|
|
|
1,619.7 |
|
|
Payment of contingent consideration |
|
— |
|
|
|
(317.1 |
) |
|
Other |
|
— |
|
|
|
(10.7 |
) |
|
Net cash provided by (used in) financing activities |
$ |
(1,024.6 |
) |
|
$ |
1,796.2 |
|
In 2020, net cash used in financing activities is primarily due to distributions to TRC, net distributions to noncontrolling interests, redemption of the Preferred Units, a net decrease of debt outstanding, partially offset by contributions from TRC and our general partner. Our distributions to noncontrolling interests are higher than our contributions from noncontrolling interests in 2020, primarily due to completion of major growth capital projects in 2019. During 2020, we issued 4⅞% Senior Notes due 2031 and drew upon the TRP Revolver, which was offset by the redemption of the 6¾% Senior Notes due March 2024, the redemption of the 5¼% Senior Notes due May 2023, and the repurchase of a portion of our Senior Notes on the open market, resulting in net decreases in debt outstanding.
In 2019, we realized a net source of cash from financing activities primarily due to the sale of ownership interests in Targa Badlands and Train 7, net increase of debt outstanding and net contributions from noncontrolling interests. The result was partially offset by payments of distributions to TRC, as well as the final contingent consideration payment associated with our purchase of Outrigger Delaware Operating, LLC, Outrigger Southern Delaware Operating, LLC and Outrigger Midland Operating, LLC (together, the “Permian Acquisition”). As part of the Permian Acquisition, which closed in March 2017, we were required to make potential earn-out payments, subject to certain performance-linked measures and other conditions. In May 2019, we made the final earn-out payment of $317.1 million. Additionally, during 2019, we issued 6½% Senior Notes due 2027, 6⅞% Senior Notes due January 2029 and 5½% Senior Notes due March 2030, with the use of proceeds primarily to repay the TRP Revolver and to redeem 4⅛% Senior Notes due November 2019, resulting in net increases in debt outstanding. We received net contributions from noncontrolling interests primarily from Stonepeak and Blackstone to fund growth projects.
Distributions
The following table details the distributions declared and/or paid by us for 2020:
|
Three Months Ended |
|
Date Paid or To Be Paid |
|
Total Distributions |
|
|
Distributions to Targa Resources Corp. |
|
||
|
(In millions, except per share amounts) |
|
|||||||||
|
December 31, 2020 |
|
February 11, 2021 |
$ |
|
54.3 |
|
$ |
|
47.6 |
|
|
September 30, 2020 |
|
November 13, 2020 |
|
|
51.7 |
|
|
|
48.9 |
|
|
June 30, 2020 |
|
August 13, 2020 |
|
|
51.7 |
|
|
|
48.9 |
|
|
March 31, 2020 |
|
May 13, 2020 |
|
|
53.1 |
|
|
|
50.3 |
|
Preferred Units
In December 2020, we redeemed all of our 5,000,000 issued and outstanding Preferred Units at a redemption price of $25.00 per unit, plus an amount equal to all unpaid distributions up to the date of redemption. The difference between the consideration paid (including unpaid distributions of $0.5 million) and the net carrying value of the units redeemed was $4.9 million, which was recorded as an increase to net income attributable to the preferred limited partners for the year ended December 31, 2020. The Preferred Units were reported as noncontrolling interests in our financial statements and were previously listed on the NYSE under the symbol “NGLS/PA” and are no longer traded following the redemption.
Prior to the redemption, distributions on our 5,000,000 Preferred Units were cumulative from the date of original issue in October 2015 and were payable monthly in arrears on the 15th day of each month of each year, when, as and if declared by the board of directors of our general partner. Distributions on the Preferred Units were payable out of amounts legally available at a rate equal to 9.0% per annum. On and after November 1, 2020, distributions on the Preferred Units accumulated at an annual floating rate equal to the one-month LIBOR plus a spread of 7.71%.
69
Capital Expenditures
The following table details cash outlays for capital projects for the years ended December 31, 2020 and 2019:
|
|
|
Year Ended December 31, |
|
|||||
|
|
|
2020 |
|
|
2019 |
|
||
|
|
|
(In millions) |
|
|||||
|
Capital expenditures: |
|
|
|
|
|
|
|
|
|
Growth (1) |
|
$ |
617.3 |
|
|
$ |
2,566.8 |
|
|
Maintenance (2) |
|
|
109.5 |
|
|
|
141.7 |
|
|
Gross capital expenditures |
|
|
726.8 |
|
|
|
2,708.5 |
|
|
Transfers from materials and supplies inventory to property, plant and equipment |
|
|
(2.1 |
) |
|
|
(25.1 |
) |
|
Change in capital project payables and accruals, net |
|
|
226.9 |
|
|
|
193.9 |
|
|
Cash outlays for capital projects |
|
$ |
951.6 |
|
|
$ |
2,877.3 |
|
________________
|
(1) |
Growth capital expenditures, net of contributions from noncontrolling interests, were $597.1 million and $2,201.7 million for the years ended December 31, 2020 and 2019. Net contributions to investments in unconsolidated affiliates were $0.8 million and $80.0 million for the years ended December 31, 2020 and 2019. |
|
(2) |
Maintenance capital expenditures, net of contributions from noncontrolling interests, were $104.2 million and $134.9 million for the years ended December 31, 2020 and 2019. |
During 2020, we invested $597.9 million in growth capital expenditures, net of contributions from noncontrolling interests and including net contributions to investments in unconsolidated affiliates. We currently estimate that in 2021 we will invest approximately $350 to $450 million in net growth capital expenditures for announced projects. Future growth capital expenditures may vary based on investment opportunities. We expect that 2021 maintenance capital expenditures, net of noncontrolling interests, will be approximately $130 million.
Total growth capital expenditures were lower for the year ended December 31, 2020 as compared to the year ended December 31, 2019, primarily due to lower spending on growth capital investments, as a significant portion of our major projects began full service in 2019, including Grand Prix, Train 6 and additional processing plants and associated infrastructure in the Permian, partially offset by spending related to Train 7 and Train 8. Total maintenance capital expenditures were lower for 2020 as compared to 2019, primarily due to timing of maintenance projects.
Off-Balance Sheet Arrangements
As of December 31, 2020, there were $69.8 million in surety bonds outstanding related to various performance obligations. These are in place to support various performance obligations as required by (i) statutes within the regulatory jurisdictions where we operate and (ii) counterparty support. Obligations under these surety bonds are not normally called, as we typically comply with the underlying performance requirement.
We have invested in entities that are not consolidated in our financial statements. For information on our obligations with respect to these investments, as well as our obligations with respect to related letters of credit, see Note 7 – Investments in Unconsolidated Affiliates and Note 8 – Debt Obligations.
70
Contractual Obligations
In addition to disclosures related to debt and lease obligations, contained in our “Consolidated Financial Statements” beginning on page F-1 of this Annual Report, the following is a summary of certain contractual obligations over the next several years:
|
|
|
Payments Due By Period |
|
||||||||||||||||||||||
|
|
|
|
|
|
|
|
Less Than |
|
|
|
|
|
|
|
|
|
|
|
|
More Than |
|
||||
|
Contractual Obligations |
|
Total |
|
|
1 Year |
|
|
1-3 Years |
|
|
3-5 Years |
|
|
5 Years |
|
||||||||||
|
|
|
(in millions) |
|
||||||||||||||||||||||
|
Long-term debt obligations (1) |
|
$ |
|
6,865.2 |
|
|
$ |
|
6.5 |
|
|
$ |
|
912.0 |
|
|
$ |
|
481.0 |
|
|
$ |
|
5,465.7 |
|
|
Interest on debt obligations (2) |
|
|
|
2,564.4 |
|
|
|
|
375.4 |
|
|
|
|
740.6 |
|
|
|
|
647.3 |
|
|
|
|
801.1 |
|
|
Finance leases (3) |
|
|
|
32.4 |
|
|
|
|
13.0 |
|
|
|
|
17.6 |
|
|
|
|
1.8 |
|
|
|
|
— |
|
|
Operating leases (4) |
|
|
|
31.2 |
|
|
|
|
10.5 |
|
|
|
|
17.1 |
|
|
|
|
3.6 |
|
|
|
|
— |
|
|
Land site lease and rights of way (5) |
|
|
|
187.2 |
|
|
|
|
4.0 |
|
|
|
|
8.6 |
|
|
|
|
10.7 |
|
|
|
|
163.9 |
|
|
|
|
|
|
|
|
|
|
|
|
|
|
|
|
|
|
|
|
|
|
|
|
|
|
|
|
|
Purchase Obligations (6): |
|
|
|
|
|
|
|
|
|
|
|
|
|
|
|
|
|
|
|
|
|
|
|
|
|
|
Pipeline capacity and throughput agreements (7) |
|
|
|
1,131.1 |
|
|
|
|
184.9 |
|
|
|
|
324.0 |
|
|
|
|
217.1 |
|
|
|
|
405.1 |
|
|
Commodities (8) |
|
|
|
24.2 |
|
|
|
|
24.2 |
|
|
|
|
— |
|
|
|
|
— |
|
|
|
|
— |
|
|
Purchase commitments and service contracts (9) |
|
|
|
210.7 |
|
|
|
|
195.9 |
|
|
|
|
5.2 |
|
|
|
|
2.5 |
|
|
|
|
7.1 |
|
|
|
|
|
|
|
|
|
|
|
|
|
|
|
|
|
|
|
|
|
|
|
|
|
|
|
|
|
Other long-term liabilities (10) |
|
|
|
39.5 |
|
|
|
|
3.5 |
|
|
|
|
5.9 |
|
|
|
|
5.2 |
|
|
|
|
24.9 |
|
|
|
|
$ |
|
11,085.9 |
|
|
$ |
|
817.9 |
|
|
$ |
|
2,031.0 |
|
|
$ |
|
1,369.2 |
|
|
$ |
|
6,867.8 |
|
|
Commodity Volumetric Commitments |
|
|
|
|
|
|
|
|
|
|
|
|
|
|
|
|
|
|
|
|
|
|
|
|
|
|
Natural gas (MMBtu) |
|
|
|
0.9 |
|
|
|
|
0.9 |
|
|
|
|
— |
|
|
|
|
— |
|
|
|
|
— |
|
|
NGLs (MMgal) |
|
|
|
87.8 |
|
|
|
|
87.8 |
|
|
|
|
— |
|
|
|
|
— |
|
|
|
|
— |
|
________________
|
(1) |
Represents scheduled future maturities of long-term debt obligations for the periods indicated. See Note 8 - Debt Obligations for more information regarding our debt obligations. |
|
(2) |
Represents interest expense on debt obligations based on both fixed debt interest rates and prevailing December 31, 2020 rates for floating debt. See Note 8 - Debt Obligations for more information regarding our debt obligations. |
|
(3) |
Includes minimum payments on finance lease obligations for vehicles and tractors. See Note 10 - Leases for more information regarding our finance leases. |
|
(4) |
Includes minimum payments on operating lease obligations for office space and railcars. See Note 10 – Leases for more information regarding our operating leases. |
|
(5) |
Land site lease and rights of way provides for surface and underground access for gathering, processing and distribution assets that are located on property not owned by us. These agreements expire at various dates with varying terms, some of which are perpetual. See Note 15 - Commitments for more information regarding our land site lease and rights of way. |
|
(6) |
A purchase obligation represents an agreement to purchase goods or services that is enforceable, legally binding and specifies all significant terms, including: fixed minimum or variable price provisions; and the approximate timing of the transaction. |
|
(7) |
Consists of pipeline capacity payments for firm transportation and throughput and deficiency agreements. |
|
(8) |
Includes natural gas and NGL purchase commitments. Contracts that will be settled at future spot prices are valued using prices as of December 31, 2020. |
|
(9) |
Includes commitments for capital expenditures, operating expenses and service contracts. |
|
(10) |
Includes long-term liabilities of which we are certain of the amount and timing, including certain arrangements that resulted in deferred revenue. See Note 9 - Other Long-term Liabilities for more information regarding our other long-term liabilities. |
Critical Accounting Policies and Estimates
The accounting policies and estimates discussed below are considered by management to be critical to an understanding of our financial statements because their application requires the most significant judgments from management in estimating matters for financial reporting that are inherently uncertain. See the description of our accounting policies in the notes to the financial statements for additional information about our critical accounting policies and estimates.
Depreciation of Property, Plant and Equipment and Amortization of Intangible Assets
Depreciation of our property, plant and equipment is computed using the straight-line method over the estimated useful lives of the assets. Our estimate of depreciation incorporates assumptions regarding the useful economic lives and residual values of our assets. The determination of useful lives of property, plant and equipment requires us to make various assumptions, including our expected use of the asset and the supply of and demand for hydrocarbons in the markets served, normal wear and tear of facilities, and the extent and frequency of maintenance programs.
We amortize the costs of our intangible assets in a manner that closely resembles the expected benefit pattern of the intangible assets or on a straight-line basis, where such pattern is not readily determinable, over the periods in which we benefit from services provided to customers. At the time assets are placed in service or acquired, we believe such assumptions are reasonable; however, circumstances may develop that would cause us to change these assumptions, which would change our depreciation/amortization amounts prospectively.
71
Impairment of Long-Lived Assets, including Intangible Assets
We evaluate long-lived assets, including intangible assets, for impairment when events or changes in circumstances indicate our carrying amount of an asset may not be recoverable, including changes to our estimates that could have an impact on our assessment of asset recoverability. Asset recoverability is measured by comparing the carrying value of the asset or asset group with its expected future pre-tax undiscounted cash flows. Individual assets are grouped at the lowest level for which the related identifiable cash flows are largely independent of the cash flows of other assets and liabilities. These cash flow estimates require us to make judgments and assumptions related to operating and cash flow results, economic obsolescence, the business climate, contractual, legal and other factors.
If the carrying amount exceeds the expected future undiscounted cash flows, we recognize a non-cash pre-tax impairment charge equal to the excess of net book value over fair value as determined by quoted market prices in active markets or present value techniques if quotes are unavailable. The estimated cash flows used to assess recoverability of our long-lived assets and measure fair value of our asset groups are derived from current business plans, which are developed using near-term price and volume projections reflective of the current environment and management's projections for long-term average prices and volumes. In addition to near and long-term price assumptions, other key assumptions include volume projections, operating costs, timing of incurring such costs and the use of an appropriate terminal value and discount rate. Any changes we make to these projections and assumptions could result in significant revisions to our evaluation of recoverability of our long-lived assets and the recognition of additional impairments.
Price Risk Management (Hedging)
Our net income and cash flows are subject to volatility stemming from changes in commodity prices and interest rates. In an effort to reduce the volatility of our cash flows, we have entered into derivative financial instruments to hedge the commodity price associated with a portion of our expected natural gas, NGL, and condensate equity volumes, future commodity purchases and sales, and transportation basis risk.
One of the factors that can affect our operating results each period is the price assumptions used to value our derivative financial instruments, which are reflected at their fair values on the balance sheet. We determine the fair value of our derivative instruments using present value methods or standard option valuation models with assumptions about commodity prices based on those observed in underlying markets. Changes in the methods or assumptions we use to calculate the fair value of our derivative instruments could have a material effect on our consolidated financial statements.
Recent Accounting Pronouncements
For a discussion of recent accounting pronouncements that will affect us, see Note 3 – Significant Accounting Policies in our Consolidated Financial Statements.
Item 7A. Quantitative and Qualitative Disclosures About Market Risk.
Our principal market risks are our exposure to changes in commodity prices, particularly to the prices of natural gas, NGLs and crude oil, changes in interest rates, as well as nonperformance by our customers.
Risk Management
We evaluate counterparty risks related to our commodity derivative contracts and trade credit. All of our commodity derivatives are with major financial institutions or major energy companies. Should any of these financial counterparties not perform, we may not realize the benefit of some of our hedges under lower commodity prices, which could have a material adverse effect on our results of operations. We sell our natural gas, NGLs and condensate to a variety of purchasers. Non-performance by a trade creditor could result in losses.
Crude oil, NGL and natural gas prices are also volatile. In an effort to reduce the variability of our cash flows, we have entered into derivative instruments to hedge the commodity price associated with a portion of our expected natural gas, NGL and condensate equity volumes, future commodity purchases and sales, and transportation basis risk through 2025. Market conditions may also impact our ability to enter into future commodity derivative contracts.
72
Commodity Price Risk
A portion of our revenues are derived from percent-of-proceeds contracts under which we receive a portion of the proceeds from the sale of commodities as payment for services. The prices of natural gas, NGLs and crude oil are subject to fluctuations in response to changes in supply, demand, market uncertainty and a variety of additional factors beyond our control. We monitor these risks and enter into hedging transactions designed to mitigate the impact of commodity price fluctuations on our business. Cash flows from a derivative instrument designated as a hedge are classified in the same category as the cash flows from the item being hedged.
The primary purpose of our commodity risk management activities is to hedge some of the exposure to commodity price risk and reduce fluctuations in our operating cash flow due to fluctuations in commodity prices. In an effort to reduce the variability of our cash flows, as of December 31, 2020, we have hedged the commodity price associated with a portion of our expected (i) natural gas, NGL, and condensate equity volumes in our Gathering and Processing operations that result from our percent-of-proceeds processing arrangements, (ii) future commodity purchases and sales in our Logistics and Transportation segment and (iii) natural gas transportation basis risk in our Logistics and Transportation segment by entering into derivative instruments. We hedge a higher percentage of our expected equity volumes in the current year compared to future years, for which we hedge incrementally lower percentages of expected equity volumes. We also enter into commodity financial instruments in conjunction with marketing opportunities available to us in the operations of our logistics and transportation assets. With swaps, we typically receive an agreed fixed price for a specified notional quantity of commodities and we pay the hedge counterparty a floating price for that same quantity based upon published index prices. Since we receive from our customers substantially the same floating index price from the sale of the underlying physical commodity, these transactions are designed to effectively lock-in the agreed fixed price in advance for the volumes hedged. In order to avoid having a greater volume hedged than our actual equity volumes, we typically limit our use of swaps to hedge the prices of less than our expected equity volumes. We utilize purchased puts (or floors) and calls (or caps) to hedge additional expected equity commodity volumes without creating volumetric risk. We may buy calls in connection with swap positions to create a price floor with upside. We intend to continue to manage our exposure to commodity prices in the future by entering into derivative transactions using swaps, collars, purchased puts (or floors), futures or other derivative instruments as market conditions permit.
When entering into new hedges, we intend to generally match the NGL product composition and the NGL and natural gas delivery points to those of our physical equity volumes. The NGL hedges cover specific NGL products based upon the expected equity NGL composition. We believe this strategy avoids uncorrelated risks resulting from employing hedges on crude oil or other petroleum products as “proxy” hedges of NGL prices. The fair value of our natural gas and NGL hedges are based on published index prices for delivery at various locations, which closely approximate the actual natural gas and NGL delivery points. A portion of our condensate sales are hedged using crude oil hedges that are based on the NYMEX futures contracts for West Texas Intermediate light, sweet crude.
A majority of these commodity price hedges are documented pursuant to a standard International Swap Dealers Association form with customized credit and legal terms. The principal counterparties (or, if applicable, their guarantors) have investment grade credit ratings. Our payment obligations in connection with substantially all of these hedging transactions and any additional credit exposure due to a rise in commodity prices relative to the fixed prices set forth in the hedges are secured by a first priority lien in the collateral securing our senior secured indebtedness that ranks equal in right of payment with liens granted in favor of our senior secured lenders. Absent federal regulations resulting from the Dodd-Frank Act, and as long as this first priority lien is in effect, we expect to have no obligation to post cash, letters of credit or other additional collateral to secure these hedges at any time, even if a counterparty’s exposure to our credit increases over the term of the hedge as a result of higher commodity prices or because there has been a change in our creditworthiness. A purchased put (or floor) transaction does not expose our counterparties to credit risk, as we have no obligation to make future payments beyond the premium paid to enter into the transaction; however, we are exposed to the risk of default by the counterparty, which is the risk that the counterparty will not honor its obligation under the put transaction.
We also enter into commodity price hedging transactions using futures contracts on futures exchanges. Exchange traded futures are subject to exchange margin requirements, so we may have to increase our cash deposit due to a rise in natural gas, NGL or crude oil prices. Unlike bilateral hedges, we are not subject to counterparty credit risks when using futures on futures exchanges.
These contracts may expose us to the risk of financial loss in certain circumstances. Generally, our hedging arrangements provide us protection on the hedged volumes if prices decline below the prices at which these hedges are set. If prices rise above the prices at which they have been hedged, we will receive less revenue on the hedged volumes than we would receive in the absence of hedges (other than with respect to purchased calls).
73
To analyze the risk associated with our derivative instruments, we utilize a sensitivity analysis. The sensitivity analysis measures the change in fair value of our derivative instruments based on a hypothetical 10% change in the underlying commodity prices, but does not reflect the impact that the same hypothetical price movement would have on the related hedged items. The financial statement impact on the fair value of a derivative instrument resulting from a change in commodity price would normally be offset by a corresponding gain or loss on the hedged item under hedge accounting. The fair values of our derivative instruments are also influenced by changes in market volatility for option contracts and the discount rates used to determine the present values.
The following table shows the effect of hypothetical price movements on the estimated fair value of our derivative instruments as of December 31, 2020:
|
|
|
Fair Value |
|
|
Result of 10% Price Decrease |
|
|
Result of 10% Price Increase |
|
|||
|
Natural gas |
|
$ |
37.5 |
|
|
$ |
73.2 |
|
|
$ |
1.9 |
|
|
NGLs |
|
|
(97.2 |
) |
|
|
(40.2 |
) |
|
|
(154.2 |
) |
|
Crude oil |
|
|
8.5 |
|
|
|
23.4 |
|
|
|
(6.2 |
) |
|
Total |
|
$ |
(51.2 |
) |
|
$ |
56.4 |
|
|
$ |
(158.5 |
) |
The table above contains all derivative instruments outstanding as of the stated date for the purpose of hedging commodity price risk, which we are exposed to due to our equity volumes and future commodity purchases and sales, as well as basis differentials related to our gas transportation arrangements.
During the years ended December 31, 2020 and 2019, our operating revenues increased (decreased) by $296.9 million and ($4.1) million, as a result of transactions accounted for as derivatives. We account for derivatives designated as hedges that mitigate commodity price risk as cash flow hedges. Changes in fair value are deferred in other comprehensive income until the underlying hedged transactions settle. We also enter into derivative instruments to help manage other short-term commodity-related business risks. We have not designated these derivatives as hedges and record changes in fair value and cash settlements to revenues.
The estimated fair value of our risk management position has moved from a net liability position of $6.1 million at December 31, 2019 to a net liability position of $51.2 million at December 31, 2020. The fixed prices we currently expect to receive on derivative contracts are below the aggregate forward prices for commodities related to those contracts, creating this net liability position.
Interest Rate Risk
We are exposed to the risk of changes in interest rates, primarily as a result of variable rate borrowings under the TRP Revolver and the Securitization Facility. As of December 31, 2020, we do not have any interest rate hedges. However, we may enter into interest rate hedges in the future with the intent to mitigate the impact of changes in interest rates on cash flows. To the extent that interest rates increase, interest expense for the TRP Revolver and the Securitization Facility will also increase. As of December 31, 2020, we had $630.0 million in outstanding variable rate borrowings under the TRP Revolver and Securitization Facility. A hypothetical change of 100 basis points in the rate of our variable interest rate debt would impact our annual interest expense by $6.3 million based on our December 31, 2020 debt balances.
Counterparty Credit Risk
We are subject to risk of losses resulting from nonpayment or nonperformance by our counterparties. The credit exposure related to commodity derivative instruments is represented by the fair value of the asset position (i.e. the fair value of expected future receipts) at the reporting date. Our futures contracts have limited credit risk since they are cleared through an exchange and are margined daily. Should the creditworthiness of one or more of the counterparties decline, our ability to mitigate nonperformance risk is limited to a counterparty agreeing to either a voluntary termination and subsequent cash settlement or a novation of the derivative contract to a third party. In the event of a counterparty default, we may sustain a loss and our cash receipts could be negatively impacted. We have master netting provisions in the International Swap Dealers Association agreements with our derivative counterparties. These netting provisions allow us to net settle asset and liability positions with the same counterparties within the same Targa entity, and would reduce our maximum loss due to counterparty credit risk by $44.2 million as of December 31, 2020. The range of losses attributable to our individual counterparties as of December 31, 2020 would be between $0.8 million and $17.5 million, depending on the counterparty in default.
74
Customer Credit Risk
We extend credit to customers and other parties in the normal course of business. We have established various procedures to manage our credit exposure, including performing initial and subsequent credit risk analyses, setting maximum credit limits and terms and requiring credit enhancements when necessary. We use credit enhancements including (but not limited to) letters of credit, prepayments, parental guarantees and rights of offset to limit credit risk to ensure that our established credit criteria are followed and financial loss is mitigated or minimized.
We have an active credit management process, which is focused on controlling loss exposure due to bankruptcies or other liquidity issues of counterparties. Our allowance for doubtful accounts was $0.1 million and $0.0 million as of December 31, 2020 and December 31, 2019. Changes in the allowance for doubtful accounts were not material for the year ended December 31, 2020.
During the years ended December 31, 2020 and 2019, sales of commodities and fees from midstream services provided to Petredec (Europe) Limited comprised approximately 11% and 12% of our consolidated revenues.
Item 8. Financial Statements and Supplementary Data.
Our “Consolidated Financial Statements,” together with the report of our independent registered public accounting firm, begin on page F-1 in this Annual Report.
Item 9. Changes in and Disagreements With Accountants on Accounting and Financial Disclosure.
None.
Item 9A. Controls and Procedures.
Evaluation of Disclosure Controls and Procedures
Management, with the participation of our Chief Executive Officer and Chief Financial Officer, has evaluated the design and effectiveness of our disclosure controls and procedures, as such term is defined in Rules 13a-15(e) and 15d-15(e) under the Securities Exchange Act of 1934, as amended (the “Exchange Act”) as of the end of the period covered in this Annual Report. Based on such evaluation, our Chief Executive Officer and Chief Financial Officer have concluded that, as of December 31, 2020, our disclosure controls and procedures were effective to provide reasonable assurance that information required to be disclosed in our reports filed or submitted under the Exchange Act is (i) recorded, processed, summarized and reported within the time periods specified in the rules and forms of the SEC and (ii) accumulated and communicated to management, including our Chief Executive Officer and Chief Financial Officer, as appropriate, to allow for timely decisions regarding required disclosure.
Internal Control Over Financial Reporting
|
(a) |
Management’s Report on Internal Control Over Financial Reporting |
Our Management’s Report on Internal Control Over Financial Reporting is included on page F-2 of this Annual Report and is incorporated herein by reference. Management concluded that our internal control over financial reporting was effective as of December 31, 2020.
|
(b) |
Changes in Internal Control Over Financial Reporting |
There have been no changes in our internal control over financial reporting during our most recent fiscal quarter ended December 31, 2020 that have materially affected, or are reasonably likely to materially affect, our internal control over financial reporting.
Item 9B. Other Information.
None.
75
PART III
Item 10. Directors, Executive Officers and Corporate Governance.
We are a limited partnership and, therefore, have no officers or directors. Unless otherwise indicated, references to our officers and directors in Items 10 through 14 of this Annual Report refer to the officers and directors of our general partner.
Management of Targa Resources Partners LP
Targa Resources GP LLC, our general partner, manages our operations and activities. Our general partner is not currently elected by our unitholders and is not subject to re-election on a regular basis in the future. Unitholders are not entitled to elect the directors of our general partner or directly or indirectly participate in our management or operation. Our general partner owes fiduciary duties to our unitholders, but our partnership agreement contains various provisions modifying and restricting its fiduciary duties. Our general partner is liable, as general partner, for all of our debts (to the extent not paid from our assets), except for indebtedness or other obligations that are made expressly nonrecourse to it. Our general partner therefore may cause us to incur indebtedness or other obligations that are nonrecourse to it.
The directors of our general partner oversee our operations. Our general partner currently has thirteen directors. Targa GP Inc. elects all members to the board of directors of our general partner (the “Board”) and our general partner has nine directors that are independent as defined under the independence standards established by the NYSE. The NYSE does not require a listed limited partnership to have a majority of independent directors on the Board or to establish a compensation committee or a nominating/corporate governance committee.
The Board has a standing audit committee (the “Audit Committee”) that consists of four directors. The members of our Audit Committee are Mses. Fulton, Bowman and Cooksen and Mr. Redd. Ms. Fulton is the Chairman of this committee. Our board of directors has affirmatively determined that Mses. Fulton, Bowman and Cooksen and Mr. Redd are independent as described in the rules of the NYSE and the Exchange Act. Our board of directors has also determined that, based upon relevant experience, Ms. Fulton is an “audit committee financial expert” as defined in Item 407 of Regulation S-K of the Exchange Act. This committee oversees, reviews, acts on and reports on various auditing and accounting matters to our board of directors, including: the selection of our independent accountants, the scope of our annual audits, fees to be paid to the independent accountants, the performance of our independent accountants and our accounting practices. In addition, the Audit Committee oversees our compliance programs relating to legal and regulatory requirements and our cybersecurity efforts and measures. We have adopted an Audit Committee charter defining the committee’s primary duties in a manner consistent with the rules of the SEC and NYSE or market standards.
The compensation of our general partner’s executive officers is set by Targa, the indirect parent of our general partner, with the Board playing no role in the process. Compensation decisions relating to oversight of the long-term incentive plan described below, however, are made by the Board. While the Board may establish a compensation committee in the future, it has no current plans to do so.
All of our executive management personnel are employees of Targa Resources and devote their time as needed to conduct our and Targa’s business and affairs. These officers of Targa Resources manage the day-to-day affairs of our business. Because Targa’s only cash generating assets are direct and indirect partnership interests in us, we expect that our executive officers will devote a substantial majority of their time to our business. We expect the amount of time that the executive management personnel of our general partner devote to our business in future periods to be driven by the needs and demands of our ongoing business and business development efforts, which are likely to increase as our asset base and operations increase in size. However, depending on how our business develops and the nature of the business development efforts by executive management, the amount of time that the executive management team of our general partner devotes to our business may increase or decrease in future periods. We also utilize a significant number of employees of Targa Resources to operate our business and provide us with general and administrative services. We reimburse Targa for allocated expenses of operational personnel who perform services for our benefit, allocated general and administrative expenses and certain direct expenses. See “Reimbursement of Expenses of Our General Partner” included in this Item 10.
Directors, Executive Officers and Other Officers
Our general partner’s directors hold office until the earlier of their death, resignation, removal or disqualification or until their successors have been elected and qualified. Officers serve at the discretion of the Board. There are no family relationships among any of our general partner’s directors or executive officers.
76
The following table shows information with respect to the current directors, executive officers and other officers of Targa Resources GP LLC as of February 18, 2021:
|
Name |
|
Age |
|
Position |
|
Matthew J. Meloy |
|
43 |
|
Chief Executive Officer and Director |
|
Patrick J. McDonie |
|
60 |
|
President – Gathering and Processing |
|
D. Scott Pryor |
|
58 |
|
President – Logistics and Transportation |
|
Robert M. Muraro |
|
44 |
|
Chief Commercial Officer |
|
Jennifer R. Kneale |
|
42 |
|
Chief Financial Officer |
|
Regina L. Gregory |
|
50 |
|
Executive Vice President, General Counsel and Secretary |
|
G. Clark White |
|
61 |
|
Executive Vice President - Operations |
|
Julie H. Boushka |
|
58 |
|
Senior Vice President and Chief Accounting Officer |
|
Paul W. Chung |
|
60 |
|
Director |
|
Joe Bob Perkins |
|
60 |
|
Director |
|
James W. Whalen |
|
79 |
|
Director |
|
Rene R. Joyce |
|
73 |
|
Director |
|
Charles R. Crisp |
|
73 |
|
Director |
|
Chris Tong |
|
64 |
|
Director |
|
Ershel C. Redd Jr. |
|
73 |
|
Director |
|
Laura C. Fulton |
|
57 |
|
Director |
|
Waters S. Davis, IV |
|
67 |
|
Director |
|
Robert B. Evans |
|
72 |
|
Director |
|
Beth A. Bowman |
|
64 |
|
Director |
|
Lindsey M. Cooksen |
|
38 |
|
Director |
Matthew J. Meloy has served as Chief Executive Officer and a director of the Company and our general partner since March 1, 2020. Mr. Meloy previously served as President of the Company and our general partner between March 2018 and March 2020. Mr. Meloy also served as Executive Vice President and Chief Financial Officer of the Company and our general partner between May 2015 and February 2018. He also served as Treasurer of the Company and our general partner until December 2015. Mr. Meloy previously served as Senior Vice President, Chief Financial Officer and Treasurer of the Company between October 2010 and May 2015 and of our general partner between December 2010 and May 2015. He also served as Vice President—Finance and Treasurer of the Company between April 2008 and October 2010, and as Director, Corporate Development of the Company between March 2006 and March 2008 and of our general partner between March 2006 and March 2008. He served as Vice President—Finance and Treasurer of our general partner between April 2008 and December 15, 2010. Mr. Meloy was with The Royal Bank of Scotland in the structured finance group, focusing on the energy sector from October 2003 to March 2006. Mr. Meloy’s extensive knowledge of the Company’s operational and strategic initiatives and capital investment program, attained from his service as President for two years and Chief Financial Officer for eight years, combined with his experience in the finance industry, brings operational, financial and capital markets experience to the Board.
Patrick J. McDonie has served as President—Gathering and Processing of the Company and our general partner since March 2018. Mr. McDonie previously served as Executive Vice President—Southern Field Gathering and Processing of the Company and our general partner between November 2015 and February 2018. He also served as President of Atlas Pipeline Partners GP LLC (“Atlas”), which was acquired by the Partnership in February 2015, between October 2013 and February 2015. He also served as Chief Operating Officer of Atlas between July 2012 and October 2013 and as Senior Vice President of Atlas between July 2012 and October 2013. He served as President of ONEOK Energy Services Company, a natural gas transportation, storage, supplier and marketing company between May 2008 and July 2012.
D. Scott Pryor has served as President—Logistics and Transportation of the Company and our general partner, since March 2018. Mr. Pryor previously served as Executive Vice President—Logistics and Marketing of the Company and our general partner between November 2015 and February 2018. He also served as Senior Vice President—NGL Logistics & Marketing of Targa Resources Operating LLC (“Targa Operating”) and various other subsidiaries of the Partnership between June 2014 and November 2015. He also served as Vice President of Targa Operating between July 2011 and May 2014 and has held officer positions with other Partnership subsidiaries since 2005.
Robert M. Muraro has served as Chief Commercial Officer of the Company and our general partner since March 2018. Mr. Muraro previously served as Executive Vice President—Commercial of the Company and our general partner between February 2017 and February 2018. He also served as Senior Vice President—Commercial and Business Development of Targa Midstream Services LLC (“Targa Midstream”) and various other subsidiaries of the Partnership between March 2016 and February 2017. He also served as Vice President—Commercial Development of Targa Midstream and various other subsidiaries of the Partnership between January 2013 and March 2016. He held the position of Director of Business Development between August 2004 and January 2013.
77
Jennifer R. Kneale has served as Chief Financial Officer of the Company and our general partner since March 2018. Ms. Kneale previously served as Vice President—Finance of the Company and our general partner between December 2015 and February 2018. She also served as Senior Director, Finance of the Company and our general partner between March 2015 and December 2015. She also served as Director, Finance of the Company and our general partner between May 2013 and February 2015. Ms. Kneale was with Tudor, Pickering, Holt & Co. in its energy private equity group, TPH Partners, from September 2011 to May 2013, most recently serving as Director of Investor Relations.
Regina L. Gregory has served as Executive Vice President, General Counsel and Secretary of the Company and our general partner since March 1, 2020. Ms. Gregory previously served as Vice President and Assistant General Counsel of the Company and our general partner between May 2019 and March 2020 and of certain of the Company’s subsidiaries between April 2019 and March 2020. From June 2017 until joining the Company in July 2018, she was Senior Vice President, General Counsel and Corporate Secretary of Frontier Midstream Services IV LLC. She also served as Senior Vice President, General Counsel and Corporate Secretary for the general partner of American Midstream Partners, LP during 2016 and 2017. Prior to that, she was General Counsel, Vice President, and Corporate Secretary of Traverse Midstream Partners, LP in 2015 and 2016 and the general partner of Access Midstream Partners LP (previously Chesapeake Midstream Partners LP) from 2010 through 2015. Additionally, Ms. Gregory held a number of legal positions with different companies, including the law firms of Jones Day and Fulbright & Jaworski (now Norton Rose Fulbright).
G. Clark White has served as Executive Vice President - Operations of the Company and our general partner since September 2020 and served as Executive Vice President -Engineering and Operations of the Company and our general partner between November 2015 and September 2020. Mr. White previously served as Senior Vice President—Field G&P of Targa Operating and various other subsidiaries of the Partnership between June 2014 and November 2015. He also served as Vice President of Targa Operating between July 2011 and May 2014 and has held officer positions with other Partnership subsidiaries since 2003.
Julie H. Boushka has served as Senior Vice President and Chief Accounting Officer of the Company and our general partner since March 2019. Ms. Boushka previously served as Vice President—Controller of the Company, our general partner and various subsidiaries of the Company between February 2017 and February 2019. She also served as Assistant Controller—Financial Accounting of the Company and our general partner between November 2016 and February 2017. Ms. Boushka served as a Senior Vice President for Financial Planning and the Chief Risk Officer for Columbia Pipeline Group (“CPG”) between June 2015 and August 2016, where she was responsible for the financial planning function and managing enterprise risk. She also served as the Business Unit Chief Financial Officer of CPG between May 2013 and June 2015, where she was responsible for the accounting and financial planning functions. Prior to that, Ms. Boushka spent approximately 18 years in various roles at El Paso Corporation (and its predecessor, Tenneco, Inc.), including accounting, financial reporting and business development.
Paul W. Chung has served as a director and Chairman of the Board of the Company and our general partner since January 1, 2021. From March 2020 until December 31, 2020, he served as Executive Vice President and Senior Legal Advisor of the Company. From May 2004 to March 2020, Mr. Chung served as Executive Vice President, General Counsel and Secretary of the Company and its predecessor entities and of our general partner since its formation. From 1999 to May 2004, he served as Executive Vice President and General Counsel of various Shell Oil Company (“Shell”) affiliates, including Coral Energy, LLC and Shell Trading North America Company. In these positions, Mr. Chung was responsible for all legal and regulatory affairs. From 1996 to 1999, he served as Vice President and Assistant General Counsel of Tejas Gas Corporation (“Tejas”). Prior to 1996, Mr. Chung held a number of legal positions with different companies, including the law firm of Vinson & Elkins L.L.P. Mr. Chung’s knowledge of the Company, together with his background in the energy industry and his legal and regulatory experience, enable Mr. Chung to provide a valuable and distinct perspective to the Board on a range of business and management matters.
Joe Bob Perkins has served as a director of the Company and our general partner since January 2012. Mr. Perkins previously served as Executive Chairman of the Board of the Company and our general partner between March 1, 2020 and December 31, 2020 and as Chief Executive Officer of the Company and our general partner between January 2012 and March 2020. He also served as President of the Company between the date of its formation on October 2005 and December 2011. Prior to 2005, Mr. Perkins served predecessor Targa companies as President since their founding in 2003. Prior to that, Mr. Perkins served in various leadership roles within the energy industry across several different companies, had employment experience with companies operating in both the midstream and upstream sectors, and was a management consultant with McKinsey & Company working primarily in energy. Mr. Perkins’ intimate knowledge of all facets of the Company, derived from his past services as Executive Chairman of the Board and as President and Chief Executive Officer, coupled with his broad experience in the energy industry, and specifically in the midstream sector, his engineering and business educational background and his experience with the investment community enable Mr. Perkins to provide a valuable and unique perspective to the Board on a range of business and management matters.
78
James W. Whalen has served as a director of the Company since its formation in October 2005 and of our general partner since February 2007. Mr. Whalen previously served as Executive Chairman of the Board of the Company and our general partner between January 2015 and March 2020. He also served as director of an affiliate of the Company during 2004 and 2005. Mr. Whalen previously served as Advisor to Chairman and CEO of the Company and our general partner between January 2012 and December 2014. He served as Executive Chairman of the Board of the Company between October 2010 and December 2011 and of our general partner between December 2010 and December 2011. He also served as President-Finance and Administration of the Company between January 2006 and October 2010 and our general partner between October 2006 and December 2010 and for various Targa subsidiaries since November 2005. Between October 2002 and October 2005, Mr. Whalen served as the Senior Vice President and Chief Financial Officer of Parker Drilling Company. Between January 2002 and October 2002, he was the Chief Financial Officer of Diversified Diagnostic Products, Inc. He served as Chief Commercial Officer of Coral Energy Holding, L.P. (“Coral”) from February 1998 through January 2000. Previously, he served as Chief Financial Officer for Tejas from 1992 to 1998. Mr. Whalen brings a breadth and depth of experience as an executive, Board member, and audit committee member across several different companies and in energy and other industry areas. His valuable management and financial expertise includes an understanding of the accounting and financial matters that the Company and industry address on a regular basis.
Rene R. Joyce has served as a director of the Company since its formation in October 2005 and of our general partner since October 2006. Mr. Joyce previously served as Executive Chairman of the Board of the Company and our general partner between January 2012 and December 2014. He also served as Chief Executive Officer of the Company between October 2005 and December 2011 and our general partner between October 2006 and December 2011. He also served as an officer and director of an affiliate of the Company during 2004 and 2005 and was a consultant for the affiliate during 2003. Mr. Joyce is a director of Apache Corporation. Mr. Joyce served as a consultant in the energy industry from 2000 through 2003 providing advice to various energy companies and investors regarding their operations, acquisitions and dispositions. Mr. Joyce served as President of onshore pipeline operations of Coral Energy, LLC, a subsidiary of Shell from 1998 through 1999 and President of energy services of Coral, a subsidiary of Shell which was the gas and power marketing joint venture between Shell and Tejas, during 1999. Mr. Joyce served as President of various operating subsidiaries of Tejas, a natural gas pipeline company, from 1990 until 1998 when Tejas was acquired by Shell. As the founding Chief Executive Officer of the Company, Mr. Joyce brings deep experience in the midstream business, expansive knowledge of the oil and gas industry, as well as relationships with chief executives and other senior management at peer companies, customers and other oil and natural gas companies throughout the world. His experience and industry knowledge, complemented by an engineering and legal educational background, enable Mr. Joyce to provide the Board with executive counsel on the full range of business, technical, and professional matters.
Charles R. Crisp has served as a director of the Company since its formation in October 2005 and of our general partner since March 2016. He also served as a director of an affiliate of the Company during 2004 and 2005. Mr. Crisp was President and Chief Executive Officer of Coral Energy, LLC, a subsidiary of Shell from 1999 until his retirement in November 2000, and was President and Chief Operating Officer of Coral from January 1998 through February 1999. Prior to this, Mr. Crisp served as President of the power generation group of Houston Industries and, between 1988 and 1996, as President and Chief Operating Officer of Tejas. Mr. Crisp is also a director of Southern Company Gas (formerly known as AGL Resources Inc.), a subsidiary of The Southern Company, EOG Resources Inc. and Intercontinental Exchange Inc. Mr. Crisp brings extensive energy experience, a vast understanding of many aspects of our industry and experience serving on the boards of other public companies in the energy industry. His leadership and business experience and deep knowledge of various sectors of the energy industry bring a crucial insight to the Board.
Chris Tong has served as a director of the Company since January 2006 and of our general partner since March 2016. Mr. Tong served as a director of Kosmos Energy Ltd. from 2011 until September 2019. He served as Senior Vice President and Chief Financial Officer of Noble Energy, Inc. from January 2005 until August 2009. He also served as Senior Vice President and Chief Financial Officer for Magnum Hunter Resources, Inc. from August 1997 until December 2004. Prior thereto, he was Senior Vice President of Finance of Tejas Acadian Holding Company and its subsidiaries, including Tejas Gas Corp., Acadian Gas Corporation and Transok, Inc., all of which were wholly-owned subsidiaries of Tejas. Mr. Tong held these positions from August 1996 until August 1997, and had served in other treasury positions with Tejas since August 1989. Mr. Tong brings a breadth and depth of experience as a chief financial officer in the energy industry, a financial executive, a director of other public companies and a member of other audit committees. He brings significant financial, capital markets and energy industry experience to the Board.
79
Ershel C. Redd Jr. has served as a director of the Company since February 2011 and of our general partner since March 2016. Mr. Redd has served as a consultant in the energy industry since 2008 providing advice to various energy companies and investors regarding their operations, acquisitions and dispositions. Mr. Redd was President and Chief Executive Officer of El Paso Electric Company, a public utility company, from May 2007 until March 2008. Prior to this, Mr. Redd served in various positions with NRG Energy, Inc., a wholesale energy company, including as Executive Vice President—Commercial Operations from October 2002 through July 2006, as President—Western Region from February 2004 through July 2006, and as a director between May 2003 and December 2003. Mr. Redd served as Vice President of Business Development for Xcel Energy Markets, a unit of Xcel Energy Inc., from 2000 through 2002, and as President and Chief Operating Officer for New Century Energy’s (predecessor to Xcel Energy Inc.) subsidiary, Texas Ohio Gas Company, from 1997 through 2000. Mr. Redd brings to the Company extensive energy industry experience, a vast understanding of varied aspects of the energy industry and experience in corporate performance, marketing and trading of natural gas and natural gas liquids, risk management, finance, acquisitions and divestitures, business development, regulatory relations and strategic planning. His leadership and business experience and deep knowledge of various sectors of the energy industry bring a crucial insight to the Board.
Laura C. Fulton has served as a director of the Company since February 2013 and of our general partner since March 2016. Ms. Fulton has served as the Vice President, Finance of the American Bureau of Shipping since January 2020. Ms. Fulton served as the Chief Financial Officer of Hi-Crush Proppants LLC from April 2012 until December 2019 and Hi-Crush GP LLC, the general partner of Hi-Crush Partners LP, from May 2012 until May 2019 and its successor, Hi-Crush Inc., from May 2019 to December 2019. On July 12, 2020, Hi-Crush Inc. and each of its direct and indirect wholly-owned domestic subsidiaries (including Hi-Crush Proppants LLC) (collectively, “Hi-Crush”) filed for protection under Chapter 11 of the Federal Bankruptcy Code. On October 9, 2020, Hi-Crush’s Chapter 11 Plan of Reorganization was confirmed. From March 2008 to October 2011, Ms. Fulton served as Executive Vice President, Accounting and then Executive Vice President, Chief Financial Officer of AEI Services, LLC (“AEI”), an owner and operator of essential energy infrastructure assets in emerging markets. Prior to AEI, Ms. Fulton spent 12 years with Lyondell Chemical Company in various capacities, including as general auditor responsible for internal audit and the Sarbanes-Oxley certification process, and as the assistant controller. Prior to that, she spent 11 years with Deloitte & Touche in public accounting, with a focus on audit and assurance. As a chief financial officer, general auditor and external auditor, Ms. Fulton brings to the company extensive financial, accounting and compliance process experience. Ms. Fulton’s experience as a financial executive in the energy industry, including her positions with a publicly-traded company and master limited partnership, also brings industry and capital markets experience to the Board.
Waters S. Davis, IV has served as director of the Company since July 2015 and of our general partner since March 2016. Mr. Davis has served as President of National Christian Foundation, Houston since July 2014. Mr. Davis was Executive Vice President of NuDevco LLC (“NuDevco”) from December 2009 to December 2013. Prior to his employment with NuDevco, he served as President of Reliant Energy Retail Services from June 1999 to January 2002 and as Executive Vice President of Spark Energy from April 2007 to November 2009. He previously served as a senior executive at a number of private companies and as an advisor to a private equity firm, providing operational and strategic guidance. Mr. Davis also serves as a director of Milacron Holdings Corp. Mr. Davis brings expertise in the retail energy, midstream and services industries, which enhances his contributions to the Board.
Robert B. Evans has served as a director of the Company since March 2016 and of our general partner since February 2007. Mr. Evans is also a director of New Jersey Resources Corporation and One Gas, Inc. Mr. Evans was a director of Sprague Resources GP LLC until October 2018. Mr. Evans was the President and Chief Executive Officer of Duke Energy Americas, a business unit of Duke Energy Corp., from January 2004 until his retirement in March 2006. Mr. Evans served as the transition executive for Energy Services, a business unit of Duke Energy, during 2003. Mr. Evans also served as President of Duke Energy Gas Transmission beginning in 1998 and was named President and Chief Executive Officer in 2002. Prior to his employment at Duke Energy, Mr. Evans served as Vice President of marketing and regulatory affairs for Texas Eastern Transmission and Algonquin Gas Transmission from 1996 to 1998. Mr. Evans’ extensive experience in the gas transmission and energy services sectors enhances the knowledge of the Board in these areas of the oil and gas industry. As a former President and CEO of various operating companies, his breadth of executive experiences is applicable to many of the matters routinely facing the Partnership.
80
Beth A. Bowman has served as a director of the Company and our general partner since September 2018. Ms. Bowman has served as a director of Sprague Resources GP LLC, the general partner of Sprague Resources LP (“Sprague”), since October 2014, and she currently serves on the Audit Committee of Sprague. Ms. Bowman held management positions at Shell Energy North America (US) L.P. (“Shell Energy”) for 17 years until her retirement in September 2015. While at Shell Energy, she held the roles of Senior Vice President of the West and Mexico and later as the Senior Vice President of Sales and Origination for Shell’s North America business. Prior to joining Shell Energy, Ms. Bowman held management positions at Sempra Energy Trading and Sempra’s San Diego Gas & Electric utility in various areas including trading and marketing, risk management, fuel and power supply, regulatory, finance and engineering. Ms. Bowman also served on the board of the California Power Exchange and the board of the California Foundation of Energy and Environment from 2004 until 2015. Ms. Bowman’s extensive energy industry background, including her experience in origination, commodities markets and risk management enhances the knowledge of the Board in these areas of the oil and gas industry.
Lindsey M. Cooksen has served as a director of the Company and our general partner since June 1, 2020. Ms. Cooksen has served as the founder and managing director of Cooksen Wealth, LLC, a wealth management firm, since April 2019. She previously held various positions with Morgan Stanley Private Wealth Management (“Morgan Stanley)” from August 2009 to April 2019. While at Morgan Stanley she held the roles of Private Wealth Advisor, Family Wealth Director and Portfolio Management Director. She also previously worked for Citigroup Global Investment Bank between July 2005 and August 2007. Ms. Cooksen’s extensive corporate experience in the financial services industry, including wealth management and portfolio construction, tax planning and analysis and risk mitigation brings financial experience and an investor’s perspective to the Board.
Reimbursement of Expenses of Our General Partner
Under the terms of our Partnership Agreement, we reimburse Targa for all direct and indirect expenses, as well as expenses otherwise allocable to us in connection with the operation of our business, incurred on our behalf, which includes certain operating and direct expenses, including compensation and benefits of operating personnel, and for the provision of various general and administrative services for our benefit. Targa performs centralized corporate functions for us, such as legal, accounting, treasury, insurance, risk management, health, safety and environmental, information technology, human resources, credit, payroll, internal audit, taxes, engineering and marketing. We reimburse Targa for the direct expenses to provide these services as well as other direct expenses it incurs on our behalf, such as compensation of operational personnel performing services for our benefit and the cost of their employee benefits, including 401(k), pension and health insurance benefits. Other than Targa’s direct costs of being a public reporting company, substantially all of Targa’s general and administrative costs have been, so long as Targa’s only cash-generating assets consist of its interest in us, and will continue to be allocated to us. See “Item 13. Certain Relationships and Related Transactions, and Director Independence.”
Board of Directors
Our general partner’s board of directors consists of thirteen members. The general partner’s board reviewed the independence of our directors using the independence standards of the NYSE and, based on this review, determined that Messrs. Joyce, Crisp, Evans, Redd, Tong and Davis and Mses. Fulton, Bowman and Cooksen are independent within the meaning of the NYSE listing standards currently in effect.
Corporate Governance
Code of Business Conduct and Ethics
Our general partner has adopted a Code of Ethics For Chief Executive Officer and Senior Financial Officers (the “Code of Ethics”), which applies to our general partner’s Chief Executive Officer, Chief Financial Officer, Chief Accounting Officer, Controllers and all of our other senior financial and accounting officers, and our Code of Conduct (the “Code of Conduct”), which applies to officers, directors and employees of the Company and its subsidiaries, including our general partner. In accordance with the disclosure requirements of applicable law or regulation, we intend to disclose any amendment to, or waiver from, any provision of the Code of Ethics or Code of Conduct under Item 5.05 of a current report on Form 8-K.
81
Available Information
We make available, free of charge within the “Corporate Governance” section of our website at http://www.targaresources.com and in print in response to written requests, our Corporate Governance Guidelines, Code of Ethics, Code of Conduct, and the Audit Committee Charter. Requests for print copies may be directed to: Investor Relations, Targa Resources Partners LP, 811 Louisiana, Suite 2100, Houston, Texas 77002 or made by telephone by calling (713) 584-1000. The information contained on or connected to, our internet website is not incorporated by reference into this Annual Report and should not be considered part of this or any other report that we file with or furnish to the SEC.
Corporate Governance Guidelines
Our general partner’s board of directors has adopted corporate governance guidelines in accordance with the corporate governance rules of the NYSE.
Executive Sessions of Independent Directors
Our independent directors meet in executive session without management participation at least once annually. These meetings are chaired by Mr. Crisp.
Interested parties may communicate directly with our non-management directors by writing to: Non-Management Directors, Targa Resources Partners LP, 811 Louisiana, Suite 2100, Houston, Texas 77002.
Item 11. Executive Compensation
Neither we nor our general partner directly employ any of the persons responsible for managing our business. All of our general partner’s executive officers are also employees of Targa. A full discussion of the compensation programs for Targa’s executive officers and the policies and philosophy of the compensation committee of Targa’s board of directors will be set forth in Targa’s 2021 proxy statement under the heading “Compensation Discussion and Analysis.”
Item 12. Security Ownership of Certain Beneficial Owners and Management and Related Unitholder Matters.
The following table sets forth information regarding the beneficial ownership of TRC common stock as of February 1, 2021 (unless otherwise indicated) held by:
|
|
• |
each person who beneficially owns 5% or more of TRC’s then outstanding shares of common stock; |
|
|
• |
each of TRC’s named executive officers; |
|
|
• |
each of TRC’s directors; and |
|
|
• |
all of TRC’s executive officers and directors as a group. |
TRC owns all of our outstanding common units. As of February 1, 2021, none of TRC’s directors or executive officers owned any preferred shares of TRC.
82
Beneficial ownership is determined under the rules of the SEC. In general, these rules attribute beneficial ownership of securities to persons who possess sole or shared voting power and/or investment power with respect to those securities and include, among other things, securities that an individual has the right to acquire within 60 days. Unless otherwise indicated, the stockholders identified in the table below have sole voting and investment power with respect to all securities shown as beneficially owned by them. Percentage ownership calculations for any security holder listed in the table below are based on 228,654,246 shares of TRC’s common stock outstanding on February 1, 2021.
|
|
|
Targa Resources Corp. |
|
|
|||||
|
|
|
|
|
|
|
Percentage of |
|
|
|
|
|
|
Common Stock |
|
|
Common Stock |
|
|
||
|
|
|
Beneficially |
|
|
Beneficially |
|
|
||
|
Name of Beneficial Owner (1) |
|
Owned |
|
|
Owned |
|
|
||
|
The Vanguard Group (2) |
|
|
23,264,742 |
|
|
|
10.17 |
% |
|
|
T. Rowe Price Associates, Inc. (3) |
|
|
17,250,268 |
|
|
|
7.54 |
% |
|
|
Joe Bob Perkins (4) |
|
|
940,667 |
|
|
* |
|
|
|
|
Matthew J. Meloy |
|
|
120,980 |
|
|
* |
|
|
|
|
Jennifer R. Kneale |
|
|
37,541 |
|
|
* |
|
|
|
|
Patrick J. McDonie |
|
|
108,556 |
|
|
* |
|
|
|
|
D. Scott Pryor |
|
|
81,743 |
|
|
* |
|
|
|
|
Robert M. Muraro |
|
|
70,245 |
|
|
* |
|
|
|
|
Paul W. Chung (5) |
|
|
560,717 |
|
|
* |
|
|
|
|
Rene R. Joyce (6) |
|
|
866,507 |
|
|
* |
|
|
|
|
James W. Whalen (7) |
|
|
673,700 |
|
|
* |
|
|
|
|
Charles R. Crisp |
|
|
122,807 |
|
|
* |
|
|
|
|
Chris Tong (8) |
|
|
96,913 |
|
|
* |
|
|
|
|
Robert B. Evans (9) |
|
|
89,190 |
|
|
* |
|
|
|
|
Ershel C. Redd Jr. |
|
|
23,646 |
|
|
* |
|
|
|
|
Laura C. Fulton |
|
|
18,679 |
|
|
* |
|
|
|
|
Waters S. Davis, IV |
|
|
15,963 |
|
|
* |
|
|
|
|
Beth A. Bowman |
|
|
8,823 |
|
|
* |
|
|
|
|
Lindsey M. Cooksen |
|
0 |
|
|
* |
|
|
||
|
All directors and executive officers as a group (20 persons) |
|
|
3,933,417 |
|
|
|
1.72 |
% |
|
|
* |
Less than 1%. |
|
(1) |
Unless otherwise indicated, the address for all beneficial owners in this table is 811 Louisiana, Suite 2100, Houston, Texas 77002. |
|
(2) |
As reported on Schedule 13G/A as of December 31, 2020 and filed with the SEC on February 10, 2021, the business address for The Vanguard Group is 100 Vanguard Blvd. Malvern, PA 19355. The Vanguard Group has sole voting power over no shares of common stock, shared voting power over 278,396 shares of common stock, sole dispositive power over 22,804,974 shares of common stock and shared dispositive power over 459,768 shares of common stock. |
|
(3) |
As reported on Schedule 13G as of December 31, 2020 and filed with the SEC on February 16, 2021, the business address for T. Rowe Price Associates, Inc. is 100 E. Pratt Street, Baltimore, MD 21202. T. Rowe Price Associates, Inc. has sole voting power over 4,906,325 shares of common stock and sole dispositive power over 17,250,268 shares of common stock. |
|
(4) |
Shares of common stock beneficially owned by Mr. Perkins include: (i) 480,283 shares issued to the Perkins Blue House Investments Limited Partnership (“PBHILP”) and (ii) 93 shares held by Mr. Perkins’ wife. Mr. Perkins is the sole member of JBP GP, L.L.C., one of the general partners of the PBHILP. |
|
(5) |
Shares of common stock beneficially owned by Mr. Chung include: (i) 244,208 shares held by the Paul Chung 2008 Family Trust, of which Mr. Chung serves as trustee; and (ii) 244,209 shares held by the Helen Chung 2007 Family Trust, of which Mr. Chung's spouse and Mr. Chung's sister-in-law serve as co-trustees. |
|
(6) |
Shares of common stock beneficially owned by Mr. Joyce include: (i) 223,759 shares issued to The Rene Joyce 2010 Grantor Retained Annuity Trust, of which Mr. Joyce and his wife are co-trustees and have shared voting and investment power; and (ii) 401,292 shares issued to The Kay Joyce 2010 Family Trust, of which Mr. Joyce’s wife is trustee and has sole voting and investment power. |
|
(7) |
Shares of common stock beneficially owned by Mr. Whalen include (i) 315,999 shares issued to the Whalen Family Investments Limited Partnership and (ii) 199,299 shares issued to the Whalen Family Investments Limited Partnership 2. |
|
(8) |
Shares of common stock beneficially owned by Mr. Tong include 434 shares held by Mr. Tong’s wife. |
(9) Shares of common stock beneficially owned by Mr. Evans include 27,000 shares held by Mr. Evan’s wife.
83
Securities Authorized for Issuance under Equity Compensation Plans
The following table sets forth certain information as of December 31, 2020 regarding TRC’s long-term incentive plans, under which TRC common stock is authorized for issuance to employees, consultants and directors of TRC, our general partner and their affiliates. TRC’s sole equity compensation plan, under which it will make equity grants, is its Amended and Restated 2010 Stock Incentive Plan, which was approved by TRC stockholders on May 22, 2017.
|
|
|
|
|
|
|
Number of securities |
|
|
|
|
|
Number of securities to |
|
Weighted average |
|
remaining available for future |
|
|
|
|
|
be issued upon exercise |
|
exercise price of |
|
issuance under equity |
|
|
|
|
|
of outstanding options, |
|
outstanding options, |
|
compensation plans (excluding |
|
|
|
Plan category |
|
warrants and rights |
|
warrants and rights |
|
securities reflected in column (a)) |
|
|
|
|
|
(a) |
|
(b) |
|
(c) |
|
|
|
Equity compensation plans approved by security holders (1) |
|
- |
|
- |
|
|
6,866,205 |
|
|
(1) |
Generally, awards of restricted stock, restricted stock units and performance share units to our officers and employees under the Stock Incentive Plan are subject to vesting over time as determined by the Compensation Committee of TRC and, prior to vesting, are subject to forfeiture. Stock incentive plan awards may vest in other circumstances, as approved by the Compensation Committee and reflected in an award agreement. Restricted stock, restricted stock units and performance share units are issued, subject to vesting, on the date of grant. The Compensation Committee of TRC may provide that dividends on restricted stock, restricted stock units or performance share units are subject to vesting and forfeiture provisions, in which case such dividends would be held, without interest, until they vest or are forfeited. |
Item 13. Certain Relationships and Related Transactions, and Director Independence.
As a result of the TRC/TRP Merger, which was completed on February 17, 2016, Targa owns all of our outstanding common units. In addition, Targa owns a 2% general partner interest in us. Our total outstanding common units as of February 10, 2017 totaled 236,595,048. In addition, Targa owns a 2% general partner interest in us, which is held through a 100% ownership interest in our general partner.
Distributions and Payments to Targa and its Affiliates
The following table summarizes the distributions and payments made and to be made by us to Targa and its affiliates in connection with our ongoing operation and any liquidation of us. These distributions and payments were determined by and among affiliated entities and, consequently, are not the result of arm’s-length negotiations.
|
Operational Stage |
|
|
Distributions of available cash to Targa and its affiliates |
Please see “Item 5. Market for Registrant’s Common Equity, Related Unitholder Matters and Issuer Purchases of Equity Securities—Distributions of Available Cash.” |
|
Payments to Targa and its affiliates |
We reimburse Targa for the payment of certain operating expenses and for the provision of various general and administrative services for our benefit. See “Reimbursement of Operating and General and Administrative Expense.” |
|
Withdrawal or removal of our general partner |
If our general partner withdraws or is removed, its general partner interest will either be sold to the new general partner for cash or converted into common units, in each case for an amount equal to the fair market value of those interests. |
|
Liquidation Stage |
|
|
Liquidation |
Upon our liquidation, the partners, including our general partner, will be entitled to receive liquidating distributions according to their respective capital account balances. |
Partnership Agreement
Our Partnership Agreement with Targa governs the reimbursement of Targa and its affiliates for costs incurred on our behalf, competition and indemnification matters. The Partnership Agreement provides that Targa and its affiliates are reimbursed for all direct and indirect expenses, as well as expenses otherwise allocable to us in connection with the operation of our business, incurred on our behalf.
84
Reimbursement of Operating and General and Administrative Expense
Under the terms of our Partnership Agreement, we reimburse Targa for all direct and indirect expenses, as well as expenses otherwise allocable to us in connection with the operation of our business, incurred on our behalf, which includes certain operating and direct expenses, including compensation and benefits of operating personnel, including 401(k), pension and health insurance benefits, and for the provision of various general and administrative services for our benefit. Targa performs centralized corporate functions for us, such as legal, accounting, treasury, insurance, risk management, health, safety and environmental, information technology, human resources, credit, payroll, internal audit, taxes, engineering and marketing. Other than Targa’s direct costs of being a public reporting company, substantially all of Targa’s general and administrative costs have been and will continue to be allocated to us, so long as Targa’s only cash-generating assets consist of its interest in us.
Competition
Targa is not restricted under our Partnership Agreement from competing with us. Targa may acquire, construct or dispose of additional midstream energy or other assets in the future without any obligation to offer us the opportunity to purchase or construct those assets.
Indemnification Agreements
Indemnification Agreements with Directors and Officers
We and our general partner have entered into Indemnification Agreements (each, an “Indemnification Agreement”) with individuals who were independent directors of Targa Resources GP LLC (each, an “Indemnitee”) prior to the TRC/TRP Merger. Each Indemnification Agreement provides that each of us and Targa Resources GP LLC will indemnify and hold harmless each Indemnitee against Expenses (as defined in the Indemnification Agreement) to the fullest extent permitted or authorized by law, including the Delaware Revised Uniform Limited Partnership Act and the Delaware Limited Liability Company Act in effect on the date of the agreement or as such laws may be amended to provide more advantageous rights to the Indemnitee. If such indemnification is unavailable as a result of a court decision and if we or Targa Resources GP LLC are jointly liable in the proceeding with the Indemnitee, we and Targa Resources GP LLC will contribute funds to the Indemnitee for his or her Expenses (as defined in the Indemnification Agreement) in proportion to relative benefit and fault of us or Targa Resources GP LLC on the one hand and Indemnitee on the other in the transaction giving rise to the proceeding.
Each Indemnification Agreement also provides that we and Targa Resources GP LLC will indemnify and hold harmless the Indemnitee against Expenses incurred for actions taken as a director or officer of us or Targa Resources GP LLC or for serving at the request of us or Targa Resources GP LLC as a director or officer or another position at another corporation or enterprise, as the case may be, but only if no final and non-appealable judgment has been entered by a court determining that, in respect of the matter for which the Indemnitee is seeking indemnification, the Indemnitee acted in bad faith or engaged in fraud or willful misconduct or, in the case of a criminal proceeding, the Indemnitee acted with knowledge that the Indemnitee’s conduct was unlawful. Each Indemnification Agreement also provides that we and Targa Resources GP LLC must advance payment of certain Expenses to the Indemnitee, including fees of counsel, subject to receipt of an undertaking from the Indemnitee to return such advance if it is ultimately determined that the Indemnitee is not entitled to indemnification.
Targa Resources Corp., the holder of all of our common units, has entered into Indemnification Agreements (each, a “Parent Indemnification Agreement”) with each director and officer of Targa (each, a “Parent Indemnitee”). Each Parent Indemnification Agreement provides that Targa Resources Corp. will indemnify and hold harmless each Parent Indemnitee for Expenses (as defined in the Parent Indemnification Agreements) to the fullest extent permitted or authorized by law, including the Delaware General Corporation Law, in effect on the date of the agreement or as it may be amended to provide more advantageous rights to the Parent Indemnitee. If such indemnification is unavailable as a result of a court decision and if Targa Resources Corp. and the Indemnitee are jointly liable in the proceeding, Targa Resources Corp. will contribute funds to the Parent Indemnitee for his or her expenses in proportion to relative benefit and fault of Targa Resources Corp. and Parent Indemnitee in the transaction giving rise to the proceeding.
Each Indemnification Agreement also provides that Targa Resources Corp. will indemnify the Parent Indemnitee for monetary damages for actions taken as a director or officer of Targa Resources Corp. or for serving at Targa’s request as a director or officer or another position at another corporation or enterprise, as the case may be but only if (i) the Parent Indemnitee acted in good faith and, in the case of conduct in his or her official capacity, in a manner he reasonably believed to be in the best interests of Targa Resources Corp. and, in all other cases, not opposed to the best interests of Targa Resources Corp. and (ii) in the case of a criminal proceeding, the Parent Indemnitee must have had no reasonable cause to believe that his or her conduct was unlawful. Each Parent Indemnification Agreement also provides that Targa Resources Corp. must advance payment of certain Expenses to the Parent Indemnitee, including fees of counsel, subject to receipt of an undertaking from the Parent Indemnitee to return such advance if it is ultimately determined that the Parent Indemnitee is not entitled to indemnification.
85
Transactions with Related Persons
Relationship with Sajet Resources LLC
In December 2010, immediately prior to Targa’s initial public offering, Sajet Resources LLC (“Sajet”) was spun-off from Targa. At the time, Rene Joyce, James Whalen and Joe Bob Perkins, directors of Targa, were also directors of Sajet. Joe Bob Perkins, James Whalen, Paul Chung, and Matthew Meloy, executive officers of Targa at the time, were also executive officers of Sajet. The current directors of Sajet are Matthew Meloy, Jennifer Kneale, Regina Gregory and Scott Rogan. The current executive officers of Sajet are Matthew Meloy, Robert Muraro, Jennifer Kneale, Regina Gregory and Julie Boushka. The primary assets of Sajet are real property. Sajet also holds (i) an ownership interest in Floridian Natural Gas Storage Company, LLC through a December 2016 merger with Tesla Resources LLC and (ii) an ownership interest in Allied CNG Ventures LLC. Former holders of our pre-IPO common equity, including certain of our current and former executives, managers and directors collectively own an 18% interest in Sajet. We hold three outstanding promissory notes from Sajet in the amounts of $9.9 million, $0.5 million and $0.2 million. The interest rate on each of the promissory notes accrues at the prime rate plus six percent annum.
Since March 2018, Sajet has been accounted for on a consolidated basis in our consolidated financial statements.
Relationship with Apache Corp.
Rene R. Joyce, a director of Targa and of our general partner, is also a director of Apache Corporation (“Apache”) with whom we purchase and sell natural gas and NGLs and engage in construction services. During 2020, we made sales to Apache of $0.4 million and purchases of $71.1 million from Apache.
Relationship with NJR Energy Services Company
Robert B. Evans, a director of Targa and of our general partner, is also a director of New Jersey Resources Corporation (“NJR”). We have gas purchase and sale arrangements with NJR Energy Services Company (“NJR Services”), a subsidiary of NJR. During 2020, we made sales of $5.5 million to NJR Services and purchases of $12.4 million from NJR Services.
Relationships with Southern Company Gas, EOG Resources Inc., and Intercontinental Exchange, Inc.
Charles R. Crisp, a director of the Company and of our general partner, is a director of Southern Company Gas, parent company of Sequent Energy Management, LP (“Sequent”) and Northern Illinois Gas Company d/b/a NICOR Energy (“NICOR”). We purchase and sell natural gas and NGL products from and to Sequent and sell natural gas products to NICOR. In addition, we purchase electricity from Mississippi Power (“MS Power”), an affiliate of Southern Company, parent company of Southern Company Gas. Mr. Crisp also serves as a director of EOG Resources, Inc. (“EOG”), from whom we purchase natural gas and from whom, together with EOG’s subsidiary EOG Resources Marketing, Inc. (“EOG Marketing”), we purchase crude oil. We also bill EOG and EOG Marketing for well connections to our gathering systems and associated equipment, and for services to operate certain EOG and jointly owned gas and crude oil gathering facilities. Mr. Crisp is also a director of Intercontinental Exchange, Inc. (“ICE Group”), parent company of ICE US OTC Commodity Markets LLC from whom we purchase brokerage services, NYSE Market Inc. and ICE NGX Canada Inc., which provide platform services utilized by us for the purchase and sale of physical gas and natural gas liquids with third parties. The following table shows our transactions with each of these entities during 2020:
|
Entity |
|
Sales |
|
|
Purchases |
|
||
|
|
|
(In millions) |
|
|||||
|
Sequent |
$ |
|
41.1 |
|
$ |
|
6.1 |
|
|
NICOR |
|
|
0.2 |
|
|
|
— |
|
|
MS Power |
|
|
— |
|
|
|
0.4 |
|
|
EOG |
|
|
19.2 |
|
|
|
1.6 |
|
|
ICE Group |
|
|
6.8 |
|
|
|
3.9 |
|
Relationship with Southwest Energy LP
Ershel C. Redd Jr., a director of Targa and of our general partner, has an immediate family member who is an officer and part owner of Southwest Energy LP (“Southwest Energy”) from and to whom we purchase and sell natural gas and NGL products. During 2020, we made sales to Southwest Energy of $22.3 million and purchases of $2.9 million from Southwest Energy.
Relationship with Intercontinental Exchange, Inc.
Jennifer R. Kneale, Chief Financial Officer of Targa and our general partner, has an immediate family member who is an officer of ICE Group. During 2020, we made sales to ICE Group of $6.8 million and purchases of $3.9 million from ICE Group.
86
These transactions were at market prices consistent with similar transactions with other nonaffiliated entities.
Conflicts of Interest
Conflicts of interest exist and may arise in the future as a result of the relationships between our general partner and its affiliates (including Targa) on the one hand and our partnership and our limited partners, on the other hand. The directors and officers of Targa Resources GP LLC have fiduciary duties to manage Targa and our general partner in a manner beneficial to its owners. At the same time, our general partner has a fiduciary duty to manage our partnership in a manner beneficial to us and our unitholders.
Whenever a conflict arises between our general partner and its affiliates on the one hand and us or any other partner on the other hand, our general partner will resolve that conflict. Our partnership agreement contains provisions that modify and limit our general partner’s fiduciary duties to our unitholders. Our partnership agreement also restricts the remedies available to unitholders for actions taken that, without those limitations, might constitute breaches of fiduciary duty.
Our general partner will not be in breach of its obligations under the partnership agreement or its duties to us or our unitholders if the resolution of the conflict is:
|
|
• |
approved by the conflicts committee, although our general partner is not obligated to seek such approval; |
|
|
• |
approved by the vote of a majority of the outstanding common units, excluding any common units owned by our general partner or any of its affiliates; |
|
|
• |
on terms no less favorable to us than those generally being provided to or available from unrelated third parties; or |
|
|
• |
fair and reasonable to us, taking into account the totality of the relationships among the parties involved, including other transactions that may be particularly favorable or advantageous to us. |
Our general partner may, but is not required to, seek the approval of such resolution from the conflicts committee of its board of directors. If our general partner does not seek approval from the conflicts committee and its board of directors determines that the resolution or course of action taken with respect to the conflict of interest satisfies either of the standards set forth in the third or fourth bullet points above, then it will be presumed that, in making its decision, the board of directors acted in good faith and in any proceeding brought by or on behalf of any limited partner of the partnership, the person bringing or prosecuting such proceeding will have the burden of overcoming such presumption. Unless the resolution of a conflict is specifically provided for in our partnership agreement, our general partner or the conflicts committee may consider any factors it determines in good faith to consider when resolving a conflict. When our partnership agreement provides that someone act in good faith, it requires that person to believe he is acting in the best interests of the partnership.
Review, Approval or Ratification of Transactions with Related Persons
If a conflict or potential conflict of interest arises between our general partner and its affiliates (including Targa) on the one hand and our partnership and our limited partners, on the other hand, the resolution of any such conflict or potential conflict is addressed as described under “−Conflicts of Interest.”
Pursuant to Targa’s Code of Conduct, our officers and directors are required to avoid any activity or interest that creates a conflict of interest between them and Targa or any of its subsidiaries, unless the conflict is disclosed and pre-approved by the Board of Directors.
Director Independence
The NYSE does not require a listed limited partnership to have a majority of independent directors on the board of directors of our general partner or to establish a compensation committee or a nominating/governance committee. Our general partner has a standing Audit Committee that consists of four directors: Mr. Redd and Mses. Fulton, Bowman and Cooksen. The board of directors of our general partner has affirmatively determined that Mr. Redd and Mses. Fulton, Bowman and Cooksen are independent as described in the rules of the NYSE and the Exchange Act for purposes of serving on the board of directors and the Audit Committee.
To be independent under the NYSE rules, a company’s board of directors must affirmatively determine that the director has no material relationship with the company (directly as a partner, stockholder or officer of an organization that has a relationship with the company). The board of directors of our general partner has made no such determination with respect to Messrs. Perkins, Whalen, Chung and Meloy because the NYSE rules do not require us to have a majority of independent directors. As such, Messrs. Perkins, Whalen, Chung and Meloy are not independent under NYSE rules applicable to service on compensation and nominating/governance committees.
87
Item 14. Principal Accounting Fees and Services.
We have engaged PricewaterhouseCoopers LLP as our independent principal accountant. The following table summarizes fees we were billed by PricewaterhouseCoopers LLP (or included in Targa’s general and administrative expense allocation to us) for independent auditing, tax and related services for each of the last two fiscal years:
|
|
|
2020 |
|
|
2019 |
|
||
|
|
|
(In millions) |
|
|||||
|
Audit fees (1) |
|
$ |
4.0 |
|
|
$ |
3.8 |
|
|
Audit-related fees (2) |
|
|
— |
|
|
|
— |
|
|
Tax fees (3) |
|
|
— |
|
|
|
— |
|
|
All other fees (4) |
|
|
0.2 |
|
|
|
0.1 |
|
|
|
|
$ |
4.2 |
|
|
$ |
3.9 |
|
________________
|
(1) |
Audit fees represent amounts billed for each of the years presented for professional services rendered in connection with (i) the integrated audit of our annual financial statements and internal control over financial reporting, (ii) the review of our quarterly financial statements or (iii) those services normally provided in connection with statutory and regulatory filings or engagements including comfort letters, consents and other services related to SEC matters. This information is presented as of the latest practicable date for this Annual Report. |
|
(2) |
Audit-related fees represent amounts we were billed in each of the years presented for assurance and related services that are reasonably related to the performance of the annual audit or quarterly reviews of our financial statements and are not reported under audit fees. |
|
(3) |
Tax fees represent amounts we were billed in each of the years presented for professional services rendered in connection with tax compliance. |
|
(4) |
All other fees represent amounts we were billed in each of the years presented for services not classifiable under the other categories listed in the table above. |
All services provided by our independent principal accountant are subject to pre-approval by the Audit Committee of our general partner. The Audit Committee of our general partner is informed of each engagement of the independent principal accountant to provide services under the policy. The Audit Committee of our general partner has approved the use of PricewaterhouseCoopers LLP as our independent principal accountant. All of the services of PricewaterhouseCoopers LLP for 2020 and 2019 described above were pre-approved by the Audit Committee.
88
PART IV
Item 15. Exhibits, Financial Statement Schedules.
(a)(1) Financial Statements
Our Consolidated Financial Statements are included under Part II, Item 8 of the Annual Report. For a listing of these statements and accompanying footnotes, see “Index to Consolidated Financial Statements” on Page F-1 in this Annual Report.
(a)(2) Financial Statement Schedules
All schedules have been omitted because they are either not applicable, not required or the information called for therein appears in the consolidated financial statements or notes thereto.
(a)(3) Exhibits
|
Number |
|
Description |
|
|
|
|
|
2.1*** |
|
|
|
|
|
|
|
2.2 |
|
|
|
|
|
|
|
2.3 |
|
|
|
|
|
|
|
2.4 |
|
|
|
|
|
|
|
2.5 |
|
|
|
|
|
|
|
2.6 |
|
|
|
|
|
|
|
2.7*** |
|
|
|
|
|
|
|
2.8*** |
|
|
|
|
|
|
|
2.9*** |
|
|
|
|
|
|
|
2.10*** |
|
|
|
|
|
|
|
2.11*** |
|
|
|
|
|
|
89
|
2.12*** |
|
|
|
|
|
|
|
2.13*** |
|
|
|
|
|
|
|
3.1 |
|
|
|
|
|
|
|
3.2 |
|
|
|
|
|
|
|
3.3 |
|
|
|
|
|
|
|
3.4 |
|
|
|
|
|
|
|
3.5 |
|
|
|
|
|
|
|
4.1 |
|
|
|
|
|
|
|
4.2 |
|
|
|
|
|
|
|
4.3 |
|
|
|
|
|
|
|
4.4 |
|
|
|
|
|
|
|
4.5 |
|
|
|
|
|
|
|
4.6 |
|
|
|
|
|
|
|
4.7 |
|
|
|
|
|
|
|
4.8 |
|
|
|
|
|
|
90
|
4.9 |
|
|
|
|
|
|
|
4.10 |
|
|
|
|
|
|
|
4.11 |
|
|
|
|
|
|
|
4.12 |
|
|
|
|
|
|
|
4.13 |
|
|
|
|
|
|
|
4.14 |
|
|
|
|
|
|
|
4.15 |
|
|
|
|
|
|
|
4.16 |
|
|
|
|
|
|
|
4.17 |
|
|
|
|
|
|
|
4.18 |
|
|
|
|
|
|
|
4.19 |
|
|
|
4.20 |
|
|
|
|
|
|
|
4.21 |
|
|
|
|
|
|
91
|
4.22 |
|
|
|
|
|
|
|
4.23 |
|
|
|
|
|
|
|
4.24 |
|
|
|
|
|
|
|
4.25 |
|
|
|
|
|
|
|
4.26 |
|
|
|
|
|
|
|
4.27 |
|
|
|
|
|
|
|
4.28 |
|
|
|
|
|
|
|
4.29 |
|
|
|
|
|
|
|
4.30 |
|
|
|
|
|
|
|
4.31 |
|
|
|
|
|
|
|
4.32 |
|
|
|
|
|
|
|
4.33 |
|
|
|
|
|
|
|
4.34 |
|
|
|
|
|
|
92
|
4.35 |
|
|
|
|
|
|
|
4.36 |
|
|
|
|
|
|
|
4.37 |
|
|
|
|
|
|
|
4.38 |
|
|
|
|
|
|
|
4.39 |
|
|
|
|
|
|
|
4.40 |
|
|
|
|
|
|
|
4.41 |
|
|
|
|
|
|
|
4.42 |
|
|
|
|
|
|
|
4.43 |
|
|
|
|
|
|
|
4.44 |
|
|
|
|
|
|
|
4.45 |
|
|
|
|
|
|
|
4.46 |
|
|
|
|
|
|
|
4.47 |
|
|
|
|
|
|
93
|
4.48 |
|
|
|
|
|
|
|
4.49 |
|
|
|
|
|
|
|
4.50 |
|
|
|
|
|
|
|
4.51 |
|
|
|
|
|
|
|
10.1 |
|
|
|
|
|
|
|
10.2 |
|
|
|
|
|
|
|
10.3 |
|
|
|
|
|
|
|
10.4 |
|
|
|
|
|
|
|
10.5 |
|
|
|
|
|
|
|
10.6 |
|
|
|
|
|
|
|
10.7 |
|
|
|
|
|
|
|
10.8 |
|
|
|
|
|
|
|
10.9 |
|
|
|
|
|
|
|
10.10 |
|
|
|
|
|
|
94
|
10.11 |
|
|
|
|
|
|
|
10.12 |
|
|
|
|
|
|
|
10.13 |
|
|
|
|
|
|
|
10.14 |
|
|
|
|
|
|
|
10.15 |
|
|
|
|
|
|
|
10.16 |
|
|
|
|
|
|
|
10.17 |
|
|
|
|
|
|
|
10.18 |
|
|
|
|
|
|
|
10.19 |
|
|
|
|
|
|
|
10.20 |
|
|
|
|
|
|
|
10.21 |
|
|
|
|
|
|
95
|
10.22 |
|
|
|
|
|
|
|
10.23+ |
|
|
|
|
|
|
|
10.24+ |
|
|
|
|
|
|
|
10.25+ |
|
|
|
|
|
|
|
10.26+ |
|
|
|
|
|
|
|
10.27+ |
|
|
|
|
|
|
|
10.28+ |
|
|
|
|
|
|
|
10.29+ |
|
|
|
|
|
|
|
10.30+ |
|
|
|
|
|
|
|
10.31+ |
|
|
|
|
|
|
|
10.32+ |
|
|
|
|
|
|
|
10.33+ |
|
|
|
|
|
|
|
10.34+ |
|
|
|
|
|
|
|
10.35+ |
|
|
|
|
|
|
|
10.36 |
|
|
|
|
|
|
|
21.1* |
|
|
|
|
|
|
|
31.1* |
|
96
|
|
|
|
|
31.2* |
|
|
|
|
|
|
|
32.1** |
|
|
|
|
|
|
|
32.2** |
|
|
|
|
|
|
|
99.1*** |
|
|
|
|
|
|
|
101.INS* |
|
Inline XBRL Instance Document |
|
|
|
|
|
101.SCH* |
|
Inline XBRL Taxonomy Extension Schema Document |
|
|
|
|
|
101.CAL* |
|
Inline XBRL Taxonomy Extension Calculation Linkbase Document |
|
|
|
|
|
101.DEF* |
|
Inline XBRL Taxonomy Extension Definition Linkbase Document |
|
|
|
|
|
101.LAB* |
|
Inline XBRL Taxonomy Extension Label Linkbase Document |
|
|
|
|
|
101.PRE* |
|
Inline XBRL Taxonomy Extension Presentation Linkbase Document
|
|
|
|
|
|
104 |
|
Cover Page Interactive Data File (embedded within the Inline XBRL document). |
|
* |
Filed herewith |
|
** |
Furnished herewith |
|
*** |
Pursuant to Item 601(b)(2) of Regulation S-K, the Partnership agrees to furnish supplementally a copy of any omitted exhibit or Schedule to the SEC upon request |
|
+ |
Management contract or compensatory plan or arrangement |
Item 16. Form 10-K Summary
None.
97
SIGNATURES
Pursuant to the requirements of Section 13 or 15(d) of the Securities Exchange Act of 1934, the registrant has duly caused this report to be signed on its behalf by the undersigned, thereunto duly authorized.
|
|
Targa Resources Partners LP |
|
|
|
(Registrant) |
|
|
|
|
|
|
|
By: |
Targa Resources GP LLC, |
|
|
|
its general partner |
|
|
|
|
|
Date: February 18, 2021 |
By: |
/s/ Jennifer R. Kneale |
|
|
|
Jennifer R. Kneale |
|
|
|
Chief Financial Officer |
|
|
|
(Principal Financial Officer) |
Pursuant to the requirements of the Securities Exchange Act of 1934, this report has been signed by the following persons on behalf of the registrant and in the capacities indicated on February 18, 2021.
|
Signature |
|
Title (Position with Targa Resources GP LLC) |
|
|
|
|
|
/s/ Matthew J. Meloy |
|
Chief Executive Officer and Director |
|
Matthew J. Meloy |
|
(Principal Executive Officer) |
|
|
|
|
|
/s/ Jennifer R. Kneale |
|
Chief Financial Officer |
|
Jennifer R. Kneale |
|
(Principal Financial Officer) |
|
|
|
|
|
/s/ Julie H. Boushka |
|
Senior Vice President and Chief Accounting Officer |
|
Julie H. Boushka |
|
(Principal Accounting Officer) |
|
|
|
|
|
/s/ Paul W. Chung |
|
Chairman of the Board and Director |
|
Paul W. Chung |
|
|
|
/s/ James W. Whalen |
|
Director |
|
James W. Whalen |
|
|
|
|
|
|
|
/s/ Charles R. Crisp |
|
Director |
|
Charles R. Crisp |
|
|
|
|
|
|
|
/s/ Waters S. Davis, IV |
|
Director |
|
Waters S. Davis, IV |
|
|
|
|
|
|
|
/s/ Robert B. Evans |
|
Director |
|
Robert B. Evans |
|
|
|
|
|
|
|
/s/ Laura C. Fulton |
|
Director |
|
Laura C. Fulton |
|
|
|
|
|
|
|
/s/ Ershel C. Redd Jr. |
|
Director |
|
Ershel C. Redd Jr. |
|
|
|
|
|
|
|
/s/ Chris Tong |
|
Director |
|
Chris Tong |
|
|
|
|
|
|
|
/s/ Rene R. Joyce |
|
Director |
|
Rene R. Joyce |
|
|
|
|
|
|
|
/s/ Beth A. Bowman |
|
Director |
|
Beth A. Bowman |
|
|
|
|
|
|
|
/s/ Lindsey M. Cooksen |
|
Director |
|
Lindsey M. Cooksen |
|
|
|
/s/ Joe Bob Perkins |
|
Director |
|
Joe Bob Perkins |
|
|
98
INDEX TO CONSOLIDATED FINANCIAL STATEMENTS
TARGA RESOURCES PARTNERS LP AUDITED CONSOLIDATED FINANCIAL STATEMENTS
|
|
|
|
|
Management's Report on Internal Control Over Financial Reporting |
F-2 |
|
|
|
|
|
|
F-3 |
||
|
|
|
|
|
Consolidated Balance Sheets as of December 31, 2020 and December 31, 2019 |
F-5 |
|
|
|
|
|
|
Consolidated Statements of Operations for the Years Ended December 31, 2020, 2019 and 2018 |
F-6 |
|
|
|
|
|
|
F-7 |
||
|
|
|
|
|
F-8 |
||
|
|
|
|
|
Consolidated Statements of Cash Flows for the Years Ended December 31, 2020, 2019 and 2018 |
F-9 |
|
|
|
|
|
|
|
||
|
|
|
|
|
|
F-10 |
|
|
|
F-10 |
|
|
|
F-10 |
|
|
|
F-17 |
|
|
|
Note 5 - Property, Plant and Equipment and Intangible Assets |
F-20 |
|
|
F-22 |
|
|
|
F-23 |
|
|
|
F-25 |
|
|
|
F-29 |
|
|
|
F-31 |
|
|
|
F-32 |
|
|
|
F-33 |
|
|
|
F-35 |
|
|
|
F-38 |
|
|
|
F-39 |
|
|
|
F-39 |
|
|
|
F-39 |
|
|
|
F-41 |
|
|
|
F-42 |
|
|
|
F-42 |
|
|
|
F-44 |
|
|
|
F-44 |
|
|
|
F-47 |
|
F-1
MANAGEMENT’S REPORT ON INTERNAL CONTROL OVER FINANCIAL REPORTING
Management is responsible for establishing and maintaining adequate internal control over financial reporting. Our internal control over financial reporting is a process designed to provide reasonable assurance regarding the reliability of financial reporting and the preparation of financial statements for external purposes in accordance with generally accepted accounting principles.
Internal control over financial reporting cannot provide absolute assurance of achieving financial reporting objectives because of its inherent limitations. Internal control over financial reporting is a process that involves human diligence and compliance and is subject to lapses in judgment and breakdowns resulting from human failures. Internal control over financial reporting also can be circumvented by collusion or improper management override. Because of such limitations, there is a risk that material misstatements may not be prevented or detected on a timely basis by internal control over financial reporting. However, these inherent limitations are known features of the financial reporting process. Therefore, it is possible to design into the process safeguards to reduce, though not eliminate, this risk.
Management has used the framework set forth in the report entitled “Internal Control—Integrated Framework” issued by the Committee of Sponsoring Organizations of the Treadway Commission (“COSO”) in 2013 to evaluate the effectiveness of the internal control over financial reporting. Based on that evaluation, management has concluded that the internal control over financial reporting was effective as of December 31, 2020.
The effectiveness of our internal control over financial reporting as of December 31, 2020 has been audited by PricewaterhouseCoopers LLP, an independent registered public accounting firm, as stated in their report which appears on page F-3.
/s/ Matthew J. Meloy
Matthew J. Meloy
Chief Executive Officer
(Principal Executive Officer)
/s/ Jennifer R. Kneale
Jennifer R. Kneale
Chief Financial Officer
(Principal Financial Officer)
F-2
Report of Independent Registered Public Accounting Firm
To the Board of Directors of Targa Resources GP LLC and the Partners of Targa Resources Partners LP
Opinions on the Financial Statements and Internal Control over Financial Reporting
We have audited the accompanying consolidated balance sheets of Targa Resources Partners LP and its subsidiaries (the “Partnership”) as of December 31, 2020 and 2019, and the related consolidated statements of operations, of comprehensive income (loss), of changes in owners' equity and of cash flows for each of the three years in the period ended December 31, 2020, including the related notes (collectively referred to as the “consolidated financial statements”). We also have audited the Partnership's internal control over financial reporting as of December 31, 2020, based on criteria established in Internal Control - Integrated Framework (2013) issued by the Committee of Sponsoring Organizations of the Treadway Commission (COSO).
In our opinion, the consolidated financial statements referred to above present fairly, in all material respects, the financial position of the Partnership as of December 31, 2020 and 2019, and the results of its operations and its cash flows for each of the three years in the period ended December 31, 2020 in conformity with accounting principles generally accepted in the United States of America. Also in our opinion, the Partnership maintained, in all material respects, effective internal control over financial reporting as of December 31, 2020, based on criteria established in Internal Control - Integrated Framework (2013) issued by the COSO.
Basis for Opinions
The Partnership's management is responsible for these consolidated financial statements, for maintaining effective internal control over financial reporting, and for its assessment of the effectiveness of internal control over financial reporting, included in the accompanying Management’s Report on Internal Control Over Financial Reporting. Our responsibility is to express opinions on the Partnership’s consolidated financial statements and on the Partnership's internal control over financial reporting based on our audits. We are a public accounting firm registered with the Public Company Accounting Oversight Board (United States) (PCAOB) and are required to be independent with respect to the Partnership in accordance with the U.S. federal securities laws and the applicable rules and regulations of the Securities and Exchange Commission and the PCAOB.
We conducted our audits in accordance with the standards of the PCAOB. Those standards require that we plan and perform the audits to obtain reasonable assurance about whether the consolidated financial statements are free of material misstatement, whether due to error or fraud, and whether effective internal control over financial reporting was maintained in all material respects.
Our audits of the consolidated financial statements included performing procedures to assess the risks of material misstatement of the consolidated financial statements, whether due to error or fraud, and performing procedures that respond to those risks. Such procedures included examining, on a test basis, evidence regarding the amounts and disclosures in the consolidated financial statements. Our audits also included evaluating the accounting principles used and significant estimates made by management, as well as evaluating the overall presentation of the consolidated financial statements. Our audit of internal control over financial reporting included obtaining an understanding of internal control over financial reporting, assessing the risk that a material weakness exists, and testing and evaluating the design and operating effectiveness of internal control based on the assessed risk. Our audits also included performing such other procedures as we considered necessary in the circumstances. We believe that our audits provide a reasonable basis for our opinions.
Definition and Limitations of Internal Control over Financial Reporting
A company’s internal control over financial reporting is a process designed to provide reasonable assurance regarding the reliability of financial reporting and the preparation of financial statements for external purposes in accordance with generally accepted accounting principles. A company’s internal control over financial reporting includes those policies and procedures that (i) pertain to the maintenance of records that, in reasonable detail, accurately and fairly reflect the transactions and dispositions of the assets of the company; (ii) provide reasonable assurance that transactions are recorded as necessary to permit preparation of financial statements in accordance with generally accepted accounting principles, and that receipts and expenditures of the company are being made only in accordance with authorizations of management and directors of the company; and (iii) provide reasonable assurance regarding prevention or timely detection of unauthorized acquisition, use, or disposition of the company’s assets that could have a material effect on the financial statements.
Because of its inherent limitations, internal control over financial reporting may not prevent or detect misstatements. Also, projections of any evaluation of effectiveness to future periods are subject to the risk that controls may become inadequate because of changes in conditions, or that the degree of compliance with the policies or procedures may deteriorate.
F-3
Critical Audit Matters
The critical audit matter communicated below is a matter arising from the current period audit of the consolidated financial statements that was communicated or required to be communicated to the audit committee and that (i) relates to accounts or disclosures that are material to the consolidated financial statements and (ii) involved our especially challenging, subjective, or complex judgments. The communication of critical audit matters does not alter in any way our opinion on the consolidated financial statements, taken as a whole, and we are not, by communicating the critical audit matter below, providing a separate opinion on the critical audit matter or on the accounts or disclosures to which it relates.
Impairment Assessment of Long-Lived Assets Related to Certain Gas Processing Facilities and Gathering Systems associated with the Central and Coastal Operations in the Gathering and Processing Segment
As described in Notes 3 and 5 to the consolidated financial statements, the Partnership’s consolidated property, plant and equipment, net and intangible assets, net balances were $12,173.7 million and $1,382.4 million, respectively, as of December 31, 2020. Management reviews and evaluates long-lived assets, including intangible assets, for impairment when events or changes in circumstances indicate that the carrying amount of an asset may not be recoverable. Asset recoverability is measured by comparing the carrying value of the asset or asset group with its expected future pre-tax undiscounted cash flows. If the carrying amount exceeds the expected future undiscounted cash flows, management recognizes a non-cash pre-tax impairment loss equal to the excess of net book value over fair value as determined by quoted market prices in active markets or present value techniques if quotes are unavailable. The estimated cash flows used to assess recoverability of the Partnership’s long-lived assets and measure fair value of the asset groups are derived from current business plans, which are developed using near-term price and volume projections reflective of the current environment and management's projections for long-term average prices and volumes. In addition to near and long-term price assumptions, other key assumptions include volume projections, operating costs, timing of incurring such costs and the use of an appropriate terminal value and discount rate. During the first quarter of 2020, global commodity prices declined due to factors that significantly impacted both demand and supply. As a result, the Partnership determined that indicators of impairment existed for certain asset groups reported primarily within the Gathering and Processing segment, and recorded non-cash pre-tax impairments of $2,442.8 million primarily associated with the partial impairment of gas processing facilities and gathering systems associated with Central operations and full impairment of Coastal operations.
The principal considerations for our determination that performing procedures relating to the impairment assessment of certain gas processing facilities and gathering systems associated with the Central and Coastal operations in the Gathering and Processing segment is a critical audit matter are (i) the significant judgment by management when developing the estimated undiscounted cash flows and subsequent estimated fair value determination by applying a discount rate, (ii) the high degree of auditor judgment, subjectivity and effort in performing procedures and evaluating management’s significant assumptions related to the future natural gas production volumes, future commodity prices, discount rate and terminal value, and (iii) the audit effort involved the use of professionals with specialized skill and knowledge.
Addressing the matter involved performing procedures and evaluating audit evidence in connection with forming our overall opinion on the consolidated financial statements. These procedures included testing the effectiveness of controls relating to the assessment of property, plant and equipment, net and intangible assets, net for impairment, including controls over management’s development of assumptions used in the estimated undiscounted cash flows and the estimated fair value associated with the Central and Coastal operations in the Gathering and Processing segment. Our procedures also included, among others (i) testing management’s process for developing the undiscounted cash flows and estimating fair value; (ii) evaluating the appropriateness of the undiscounted and discounted cash flow models; (iii) testing the completeness and accuracy of data used in the models, and (iv) evaluating the significant assumptions used by management related to the future natural gas production volumes, future commodity prices, discount rate and terminal value. Evaluating management’s assumptions related to future natural gas production volumes, future commodity prices, discount rate and terminal value involved evaluating whether the assumptions used by management were reasonable considering the current and past performance of the asset groups, the consistency with external market and industry data, and whether the assumptions were consistent with evidence obtained in other areas of the audit. Professionals with specialized skill and knowledge were used to assist in evaluating the appropriateness of the models and the reasonableness of the discount rate and terminal value assumptions.
/s/ PricewaterhouseCoopers LLP
Houston, Texas
February 18, 2021
We have served as the Partnership’s auditor since 2005.
F-4
PART I – FINANCIAL INFORMATION
Item 1. Financial Statements.
TARGA RESOURCES PARTNERS LP
CONSOLIDATED BALANCE SHEETS
|
|
|
December 31, 2020 |
|
|
December 31, 2019 |
|
||||||||||
|
|
|
(In millions) |
|
|||||||||||||
|
ASSETS |
|
|||||||||||||||
|
Current assets: |
|
|
|
|
|
|
|
|
||||||||
|
Cash and cash equivalents |
|
$ |
|
|
|
$ |
|
|
||||||||
|
Trade receivables, net of allowances of $ |
|
|
|
|
|
|
|
|
||||||||
|
Inventories |
|
|
|
|
|
|
|
|
||||||||
|
Assets from risk management activities |
|
|
|
|
|
|
|
|
||||||||
|
Held for sale assets |
|
|
— |
|
|
|
|
|
||||||||
|
Other current assets |
|
|
|
|
|
|
|
|
||||||||
|
Total current assets |
|
|
|
|
|
|
|
|
||||||||
|
Property, plant and equipment, net |
|
|
|
|
|
|
|
|
||||||||
|
Intangible assets, net |
|
|
|
|
|
|
|
|
||||||||
|
Long-term assets from risk management activities |
|
|
|
|
|
|
|
|
||||||||
|
Investments in unconsolidated affiliates |
|
|
|
|
|
|
|
|
||||||||
|
Other long-term assets |
|
|
|
|
|
|
|
|
||||||||
|
Total assets |
|
$ |
|
|
|
$ |
|
|
||||||||
|
|
|
|
|
|
|
|
|
|
||||||||
|
LIABILITIES AND OWNERS' EQUITY |
|
|||||||||||||||
|
Current liabilities: |
|
|
|
|
|
|
|
|
||||||||
|
Accounts payable |
|
$ |
|
|
|
$ |
|
|
||||||||
|
Accrued liabilities |
|
|
|
|
|
|
|
|
||||||||
|
Distributions payable |
|
|
|
|
|
|
|
|
||||||||
|
Interest payable |
|
|
|
|
|
|
|
|
||||||||
|
Accounts payable to Targa Resources Corp. |
|
|
|
|
|
|
|
|
||||||||
|
Liabilities from risk management activities |
|
|
|
|
|
|
|
|
||||||||
|
Current debt obligations |
|
|
|
|
|
|
|
|
||||||||
|
Held for sale liabilities |
|
|
— |
|
|
|
|
|
||||||||
|
Total current liabilities |
|
|
|
|
|
|
|
|
||||||||
|
Long-term debt |
|
|
|
|
|
|
|
|
||||||||
|
Long-term liabilities from risk management activities |
|
|
|
|
|
|
|
|
||||||||
|
Deferred income taxes, net |
|
|
|
|
|
|
|
|
||||||||
|
Other long-term liabilities |
|
|
|
|
|
|
|
|
||||||||
|
Contingencies (see Note 16) |
|
|
|
|
|
|
|
|
||||||||
|
Owners' equity: |
|
|
|
|
|
|
|
|
||||||||
|
Series A preferred limited partners |
Issued |
|
|
Outstanding |
|
|
|
|
— |
|
|
|
|
|
||
|
December 31, 2020 |
|
- |
|
|
|
- |
|
|
|
|
|
|
|
|
|
|
|
December 31, 2019 |
|
|
|
|
|
|
|
|
|
|
|
|
|
|
|
|
|
Common limited partners |
Issued |
|
|
Outstanding |
|
|
|
|
|
|
|
|
|
|
||
|
December 31, 2020 |
|
|
|
|
|
|
|
|
|
|
|
|
|
|
|
|
|
December 31, 2019 |
|
|
|
|
|
|
|
|
|
|
|
|
|
|
|
|
|
General partner |
Issued |
|
|
Outstanding |
|
|
|
|
|
|
|
|
|
|
||
|
December 31, 2020 |
|
|
|
|
|
|
|
|
|
|
|
|
|
|
|
|
|
December 31, 2019 |
|
|
|
|
|
|
|
|
|
|
|
|
|
|
|
|
|
Accumulated other comprehensive income (loss) |
|
|
|
|
|
( |
) |
|
|
|
|
|||||
|
|
|
|
|
|
|
|
|
|
||||||||
|
Noncontrolling interests |
|
|
|
|
|
|
|
|
|
|
|
|||||
|
Total owners' equity |
|
|
|
|
|
|
|
|
||||||||
|
Total liabilities and owners' equity |
|
$ |
|
|
|
$ |
|
|
||||||||
|
|
|
|
|
|
|
|
|
|
||||||||
|
See notes to consolidated financial statements. |
|
|||||||||||||||
F-5
TARGA RESOURCES PARTNERS LP
CONSOLIDATED STATEMENTS OF OPERATIONS
|
|
Year Ended December 31, |
|
||||||||||
|
|
2020 |
|
|
2019 |
|
|
2018 |
|
||||
|
Revenues: |
|
|
|
|
(In millions) |
|
|
|
|
|
||
|
Sales of commodities |
$ |
|
|
|
$ |
|
|
|
$ |
|
|
|
|
Fees from midstream services |
|
|
|
|
|
|
|
|
|
|
|
|
|
Total revenues |
|
|
|
|
|
|
|
|
|
|
|
|
|
Costs and expenses: |
|
|
|
|
|
|
|
|
|
|
|
|
|
Product purchases |
|
|
|
|
|
|
|
|
|
|
|
|
|
Operating expenses |
|
|
|
|
|
|
|
|
|
|
|
|
|
Depreciation and amortization expense |
|
|
|
|
|
|
|
|
|
|
|
|
|
General and administrative expense |
|
|
|
|
|
|
|
|
|
|
|
|
|
Impairment of long-lived assets |
|
|
|
|
|
|
|
|
|
|
|
|
|
|
Impairment of goodwill |
|
|
|
|
|
|
|
|
|
|
|
|
Other operating (income) expense |
|
|
|
|
|
|
|
|
|
|
|
|
|
Income (loss) from operations |
|
( |
) |
|
|
|
|
|
|
|
|
|
|
Other income (expense): |
|
|
|
|
|
|
|
|
|
|
|
|
|
Interest expense, net |
|
( |
) |
|
|
( |
) |
|
|
( |
) |
|
|
Equity earnings (loss) |
|
|
|
|
|
|
|
|
|
|
|
|
|
Gain (loss) from financing activities |
|
|
|
|
|
( |
) |
|
|
( |
) |
|
|
Gain (loss) from sale of equity-method investment |
|
|
|
|
|
|
|
|
|
|
|
|
|
Change in contingent considerations |
|
|
|
|
|
( |
) |
|
|
|
|
|
|
Other, net |
|
|
|
|
|
|
|
|
|
|
|
|
|
Income (loss) before income taxes |
|
( |
) |
|
|
( |
) |
|
|
|
|
|
|
Income tax (expense) benefit |
|
|
|
|
|
|
|
|
|
|
|
|
|
Net income (loss) |
|
( |
) |
|
|
( |
) |
|
|
|
|
|
|
Less: Net income (loss) attributable to noncontrolling interests |
|
|
|
|
|
|
|
|
|
|
|
|
|
Net income (loss) attributable to Targa Resources Partners LP |
$ |
( |
) |
|
$ |
( |
) |
|
$ |
|
|
|
|
|
|
|
|
|
|
|
|
|
|
|
|
|
|
Net income attributable to preferred limited partners |
$ |
|
|
|
$ |
|
|
|
$ |
|
|
|
|
Net income (loss) attributable to general partner |
|
( |
) |
|
|
( |
) |
|
|
|
|
|
|
Net income (loss) attributable to common limited partners |
|
( |
) |
|
|
( |
) |
|
|
|
|
|
|
Net income (loss) attributable to Targa Resources Partners LP |
$ |
( |
) |
|
$ |
( |
) |
|
$ |
|
|
|
See notes to consolidated financial statements.
F-6
TARGA RESOURCES PARTNERS LP
CONSOLIDATED STATEMENTS OF COMPREHENSIVE INCOME (LOSS)
|
|
|
Year Ended December 31, |
|
|||||||||
|
|
|
2020 |
|
|
2019 |
|
|
2018 |
|
|||
|
|
|
(In millions) |
|
|||||||||
|
Net income (loss) |
|
$ |
( |
) |
|
$ |
( |
) |
|
$ |
|
|
|
Other comprehensive income (loss): |
|
|
|
|
|
|
|
|
|
|
|
|
|
Commodity hedging contracts: |
|
|
|
|
|
|
|
|
|
|
|
|
|
Change in fair value |
|
|
( |
) |
|
|
|
|
|
|
|
|
|
Settlements reclassified to revenues |
|
|
( |
) |
|
|
( |
) |
|
|
|
|
|
Other comprehensive income (loss) |
|
|
( |
) |
|
|
( |
) |
|
|
|
|
|
Comprehensive income (loss) |
|
|
( |
) |
|
|
( |
) |
|
|
|
|
|
Less: Comprehensive income (loss) attributable to noncontrolling interests |
|
|
|
|
|
|
|
|
|
|
|
|
|
Comprehensive income (loss) attributable to Targa Resources Partners LP |
|
$ |
( |
) |
|
$ |
( |
) |
|
$ |
|
|
See notes to consolidated financial statements.
F-7
TARGA RESOURCES PARTNERS LP
CONSOLIDATED STATEMENTS OF CHANGES IN OWNERS' EQUITY
|
|
|
|
|
|
|
|
|
|
|
|
|
|
|
|
|
|
|
|
|
|
|
|
|
|
|
Accumulated |
|
|
|
|
|
|
|
|
|
|
|
|
|
Limited |
|
|
Limited |
|
|
General |
|
|
Other |
|
|
Non- |
|
|
|
|
|
|||||||||||||||||
|
|
|
Partner |
|
|
Partner |
|
|
Partner |
|
|
Comprehensive |
|
|
controlling |
|
|
|
|
|
|||||||||||||||||
|
|
|
Preferred |
|
|
Amount |
|
|
Common |
|
|
Amount |
|
|
Units |
|
|
Amount |
|
|
Income (Loss) |
|
|
Interests |
|
|
Total |
|
|||||||||
|
|
|
(In millions, except units in thousands) |
|
|||||||||||||||||||||||||||||||||
|
Balance, December 31, 2017 |
|
|
|
|
|
$ |
|
|
|
|
|
|
|
$ |
|
|
|
|
|
|
|
$ |
|
|
|
$ |
( |
) |
|
$ |
|
|
|
$ |
|
|
|
Contributions from Targa Resources Corp. |
|
|
|
|
|
|
|
|
|
|
|
|
|
|
|
|
|
|
|
|
|
|
|
|
|
|
|
|
|
|
|
|
|
|
|
|
|
Acquisition of related party |
|
|
— |
|
|
|
|
|
|
|
— |
|
|
|
|
|
|
|
— |
|
|
|
|
|
|
|
|
|
|
|
|
|
|
|
|
|
|
Purchase of noncontrolling interests in subsidiaries, net |
|
|
|
|
|
|
|
|
|
|
|
|
|
|
|
|
|
|
|
|
|
|
|
|
|
|
|
|
|
|
( |
) |
|
|
( |
) |
|
Distributions to noncontrolling interests |
|
|
— |
|
|
|
|
|
|
|
— |
|
|
|
|
|
|
|
— |
|
|
|
|
|
|
|
|
|
|
|
( |
) |
|
|
( |
) |
|
Contributions from noncontrolling interests |
|
|
|
|
|
|
|
|
|
|
|
|
|
|
|
|
|
|
|
|
|
|
|
|
|
|
|
|
|
|
|
|
|
|
|
|
|
Other comprehensive income (loss) |
|
|
— |
|
|
|
|
|
|
|
— |
|
|
|
|
|
|
|
— |
|
|
|
|
|
|
|
|
|
|
|
|
|
|
|
|
|
|
Net income (loss) |
|
|
— |
|
|
|
|
|
|
|
— |
|
|
|
|
|
|
|
— |
|
|
|
|
|
|
|
|
|
|
|
|
|
|
|
|
|
|
Distributions |
|
|
— |
|
|
|
( |
) |
|
|
— |
|
|
|
( |
) |
|
|
— |
|
|
|
( |
) |
|
|
|
|
|
|
|
|
|
|
( |
) |
|
Balance, December 31, 2018 |
|
|
|
|
|
|
|
|
|
|
|
|
|
|
|
|
|
|
|
|
|
|
|
|
|
|
|
|
|
|
|
|
|
|
|
|
|
Contributions from Targa Resources Corp. |
|
|
|
|
|
|
|
|
|
|
|
|
|
|
|
|
|
|
|
|
|
|
|
|
|
|
|
|
|
|
|
|
|
|
|
|
|
Sale of ownership interests in subsidiaries |
|
|
— |
|
|
|
|
|
|
|
— |
|
|
|
( |
) |
|
|
— |
|
|
|
( |
) |
|
|
|
|
|
|
|
|
|
|
|
|
|
Distributions to noncontrolling interests |
|
|
— |
|
|
|
|
|
|
|
— |
|
|
|
|
|
|
|
— |
|
|
|
|
|
|
|
|
|
|
|
( |
) |
|
|
( |
) |
|
Contributions from noncontrolling interests |
|
|
— |
|
|
|
|
|
|
|
— |
|
|
|
|
|
|
|
— |
|
|
|
|
|
|
|
|
|
|
|
|
|
|
|
|
|
|
Other comprehensive income (loss) |
|
|
— |
|
|
|
|
|
|
|
— |
|
|
|
|
|
|
|
— |
|
|
|
|
|
|
|
( |
) |
|
|
|
|
|
|
( |
) |
|
Net income (loss) |
|
|
— |
|
|
|
|
|
|
|
— |
|
|
|
( |
) |
|
|
— |
|
|
|
( |
) |
|
|
|
|
|
|
|
|
|
|
( |
) |
|
Distributions |
|
|
— |
|
|
|
( |
) |
|
|
— |
|
|
|
( |
) |
|
|
— |
|
|
|
( |
) |
|
|
|
|
|
|
|
|
|
|
( |
) |
|
Balance, December 31, 2019 |
|
|
|
|
|
|
|
|
|
|
|
|
|
|
|
|
|
|
|
|
|
|
|
|
|
|
|
|
|
|
|
|
|
|
|
|
|
Contributions from Targa Resources Corp. |
|
|
|
|
|
|
|
|
|
|
|
|
|
|
|
|
|
|
|
|
|
|
|
|
|
|
|
|
|
|
|
|
|
|
|
|
|
Distributions to noncontrolling interests |
|
|
— |
|
|
|
|
|
|
|
— |
|
|
|
|
|
|
|
— |
|
|
|
|
|
|
|
|
|
|
|
( |
) |
|
|
( |
) |
|
Contributions from noncontrolling interests |
|
|
— |
|
|
|
|
|
|
|
— |
|
|
|
|
|
|
|
— |
|
|
|
|
|
|
|
|
|
|
|
|
|
|
|
|
|
|
Non-cash allocation to noncontrolling interests |
|
|
— |
|
|
|
|
|
|
|
|
|
|
|
|
|
|
|
|
|
|
|
|
|
|
|
|
|
|
|
|
|
|
|
|
|
|
Other comprehensive income (loss) |
|
|
— |
|
|
|
|
|
|
|
— |
|
|
|
|
|
|
|
— |
|
|
|
|
|
|
|
( |
) |
|
|
|
|
|
|
( |
) |
|
Redemption of Preferred Units |
|
|
( |
) |
|
|
( |
) |
|
|
|
|
|
|
|
|
|
|
|
|
|
|
|
|
|
|
|
|
|
|
|
|
|
|
( |
) |
|
Net income (loss) |
|
|
— |
|
|
|
|
|
|
|
— |
|
|
|
( |
) |
|
|
— |
|
|
|
( |
) |
|
|
|
|
|
|
|
|
|
|
( |
) |
|
Distributions |
|
|
— |
|
|
|
( |
) |
|
|
— |
|
|
|
( |
) |
|
|
— |
|
|
|
( |
) |
|
|
|
|
|
|
|
|
|
|
( |
) |
|
Balance, December 31, 2020 |
|
|
|
|
|
$ |
|
|
|
|
|
|
|
$ |
|
|
|
|
|
|
|
$ |
|
|
|
$ |
( |
) |
|
$ |
|
|
|
$ |
|
|
See notes to consolidated financial statements.
F-8
TARGA RESOURCES PARTNERS LP
CONSOLIDATED STATEMENTS OF CASH FLOWS
|
|
|
Year Ended December 31, |
|
||||||||||
|
|
|
2020 |
|
|
2019 |
|
|
2018 |
|
||||
|
|
|
|
|||||||||||
|
|
(In millions) |
|
|||||||||||
|
Cash flows from operating activities |
|
|
|
|
|
|
|
|
|
|
|
|
|
|
Net income (loss) |
|
$ |
( |
) |
|
$ |
( |
) |
|
$ |
|
|
|
|
Adjustments to reconcile net income (loss) to net cash provided by operating activities: |
|
|
|
|
|
|
|
|
|
|
|
|
|
|
Amortization in interest expense |
|
|
|
|
|
|
|
|
|
|
|
|
|
|
Depreciation and amortization expense |
|
|
|
|
|
|
|
|
|
|
|
|
|
|
Impairment of long-lived assets |
|
|
|
|
|
|
|
|
|
|
|
|
|
|
Impairment of goodwill |
|
|
|
|
|
|
|
|
|
|
|
|
|
|
Accretion of asset retirement obligations |
|
|
|
|
|
|
|
|
|
|
|
|
|
|
Increase (decrease) in redemption value of mandatorily redeemable preferred interests |
|
|
|
|
|
|
|
|
|
|
( |
) |
|
|
Deferred income tax expense (benefit) |
|
|
( |
) |
|
|
( |
) |
|
|
( |
) |
|
|
Equity (earnings) loss of unconsolidated affiliates |
|
|
( |
) |
|
|
( |
) |
|
|
( |
) |
|
|
Distributions of earnings received from unconsolidated affiliates |
|
|
|
|
|
|
|
|
|
|
|
|
|
|
Risk management activities |
|
|
( |
) |
|
|
|
|
|
|
|
|
|
|
(Gain) loss on sale or disposition of business and assets |
|
|
|
|
|
|
|
|
|
|
( |
) |
|
|
Write-downs of assets |
|
|
|
|
|
|
|
|
|
|
|
|
|
|
(Gain) loss from financing activities |
|
|
( |
) |
|
|
|
|
|
|
|
|
|
|
(Gain) loss from sale of equity-method investment |
|
|
|
|
|
|
|
( |
) |
|
|
|
|
|
Change in contingent considerations |
|
|
( |
) |
|
|
|
|
|
|
( |
) |
|
|
Changes in operating assets and liabilities, net of business acquisitions: |
|
|
|
|
|
|
|
|
|
|
|
|
|
|
Receivables and other assets |
|
|
( |
) |
|
|
( |
) |
|
|
( |
) |
|
|
Inventories |
|
|
( |
) |
|
|
( |
) |
|
|
( |
) |
|
|
Accounts payable, accrued liabilities and other liabilities |
|
|
|
|
|
|
|
|
|
|
|
|
|
|
Interest payable |
|
|
|
|
|
|
|
|
|
|
|
|
|
|
Net cash provided by operating activities |
|
|
|
|
|
|
|
|
|
|
|
|
|
|
Cash flows from investing activities |
|
|
|
|
|
|
|
|
|
|
|
|
|
|
Outlays for property, plant and equipment |
|
|
( |
) |
|
|
( |
) |
|
|
( |
) |
|
|
Proceeds from sale of business and assets |
|
|
|
|
|
|
|
|
|
|
|
|
|
|
Investments in unconsolidated affiliates |
|
|
( |
) |
|
|
( |
) |
|
|
( |
) |
|
|
Proceeds from sale of equity-method investment |
|
|
|
|
|
|
|
|
|
|
|
|
|
|
Return of capital from unconsolidated affiliates |
|
|
|
|
|
|
|
|
|
|
|
|
|
|
Other, net |
|
|
|
|
|
|
( |
) |
|
|
( |
) |
|
|
Net cash used in investing activities |
|
|
( |
) |
|
|
( |
) |
|
|
( |
) |
|
|
Cash flows from financing activities |
|
|
|
|
|
|
|
|
|
|
|
|
|
|
Debt obligations: |
|
|
|
|
|
|
|
|
|
|
|
|
|
|
Proceeds from borrowings under credit facility |
|
|
|
|
|
|
|
|
|
|
|
|
|
|
Repayments of credit facility |
|
|
( |
) |
|
|
( |
) |
|
|
( |
) |
|
|
Proceeds from borrowings under accounts receivable securitization facility |
|
|
|
|
|
|
|
|
|
|
|
|
|
|
Repayments of accounts receivable securitization facility |
|
|
( |
) |
|
|
( |
) |
|
|
( |
) |
|
|
Proceeds from issuance of senior notes |
|
|
|
|
|
|
|
|
|
|
|
|
|
|
Redemption of senior notes |
|
|
( |
) |
|
|
( |
) |
|
|
|
|
|
|
Principal payments of finance leases |
|
|
( |
) |
|
|
( |
) |
|
|
|
|
|
|
Costs incurred in connection with financing arrangements |
|
|
( |
) |
|
|
( |
) |
|
|
( |
) |
|
|
Payment of contingent consideration |
|
|
|
|
|
|
( |
) |
|
|
|
|
|
|
Purchase of noncontrolling interests in subsidiary |
|
|
|
|
|
|
|
|
|
|
( |
) |
|
|
Sale of ownership interests in subsidiaries |
|
|
|
|
|
|
|
|
|
|
|
|
|
|
Contributions from general partner |
|
|
|
|
|
|
|
|
|
|
|
|
|
|
Contributions from TRC |
|
|
|
|
|
|
|
|
|
|
|
|
|
|
Contributions from noncontrolling interests |
|
|
|
|
|
|
|
|
|
|
|
|
|
|
Redemption of Preferred Units |
|
|
|
( |
) |
|
|
|
|
|
|
|
|
|
Distributions to noncontrolling interests |
|
|
( |
) |
|
|
( |
) |
|
|
( |
) |
|
|
Distributions to unitholders |
|
|
( |
) |
|
|
( |
) |
|
|
( |
) |
|
|
Net cash provided by (used in) financing activities |
|
|
( |
) |
|
|
|
|
|
|
|
|
|
|
Net change in cash and cash equivalents |
|
|
( |
) |
|
|
|
|
|
|
|
|
|
|
Cash and cash equivalents, beginning of period |
|
|
|
|
|
|
|
|
|
|
|
|
|
|
Cash and cash equivalents, end of period |
|
$ |
|
|
|
$ |
|
|
|
$ |
|
|
|
See notes to consolidated financial statements.
F-9
TARGA RESOURCES PARTNERS LP
NOTES TO CONSOLIDATED FINANCIAL STATEMENTS
Except as noted within the context of each footnote disclosure, the dollar amounts presented in the tabular data within these footnote disclosures are stated in millions of dollars.
Note 1 — Organization and Operations
Our Organization
Targa Resources Partners LP is a Delaware limited partnership formed in October 2006 by our parent, Targa Resources Corp. (“Targa” or “TRC” or the “Company” or “Parent”). In this Annual Report, unless the context requires otherwise, references to “we,” “us,” “our,” “TRP,” or the “Partnership” are intended to mean the business and operations of Targa Resources Partners LP and its consolidated subsidiaries.
Our common units are wholly owned by TRC and no longer publicly traded as a result of TRC’s acquisition of our outstanding common units that it and its subsidiaries did not already own in 2016.
The
Our Operations
We are primarily engaged in the business of:
|
|
• |
gathering, compressing, treating, processing, transporting and purchasing and selling natural gas; |
|
|
• |
transporting, storing, fractionating, treating and purchasing and selling NGLs and NGL products, including services to LPG exporters; and |
|
|
• |
gathering, storing, terminaling and purchasing and selling crude oil. |
See Note 23 – Segment Information for certain financial information regarding our business segments.
The employees supporting our operations are employed by Targa. Our consolidated financial statements include the direct costs of Targa employees deployed to our operating segments, as well as an allocation of costs associated with our usage of Targa’s centralized general and administrative services.
Note 2 — Basis of Presentation
These accompanying financial statements and related notes present our consolidated financial position as of December 31, 2020 and 2019, and the results of operations, comprehensive income, cash flows, and changes in owners’ equity for the years ended December 31, 2020, 2019 and 2018.
We have prepared these consolidated financial statements in accordance with GAAP. All significant intercompany balances and transactions have been eliminated in consolidation. Certain amounts in prior periods may have been reclassified to conform to the current year presentation.
Note 3 — Significant Accounting Policies
Consolidation Policy
Our consolidated financial statements include the accounts of all entities that we control and our proportionate interest in the accounts of certain gas gathering and processing facilities in which we own an undivided interest and are responsible for our proportionate share of the costs and expenses of the facilities. Third party ownership interests in our controlled subsidiaries are presented as noncontrolling interests within the equity section of our Consolidated Balance Sheets. In our Consolidated Statements of Operations and Consolidated Statements of Comprehensive Income, noncontrolling interests reflects the attribution of results to third-party investors. All intercompany balances and transactions have been eliminated in consolidation.
F-10
We apply the equity method of accounting to investments over which we exercise significant influence over the operating and financial policies of our investee, but do not exercise control. We evaluate our equity investments for impairment when evidence indicates the carrying amount of our investment is no longer recoverable. Evidence of a loss in value might include, but would not necessarily be limited to, absence of an ability to recover the carrying amount of the investment or inability of the equity method investee to sustain an earnings capacity that would justify the carrying amount of the investment. When the estimated fair value of an equity investment is less than its carrying value and the loss in value is determined to be other than temporary, we recognize the excess of the carrying value over the estimated fair value as a non-cash pre-tax impairment loss within equity earnings (loss) in our Consolidated Statements of Operations.
Use of Estimates
The preparation of financial statements in conformity with GAAP requires management to make estimates and assumptions that affect the amounts reported in these financial statements and accompanying notes. Estimates and judgments are based on information available at the time such estimates and judgments are made. Changes in facts and circumstances may result in revised estimates and actual results could differ materially from those estimates. Estimates and judgments are used in, among other things, (1) estimating unbilled revenues, product purchases and operating and general and administrative cost accruals, (2) developing fair value assumptions, including estimates of future cash flows and discount rates, (3) analyzing long-lived assets for possible impairment, (4) estimating the useful lives of assets, (5) estimating contingencies, guarantees and indemnifications and (6) estimating redemption value of mandatorily redeemable preferred interests.
Cash and Cash Equivalents
Cash and cash equivalents include all cash on hand, demand deposits, and short-term, highly liquid investments that are readily convertible into cash, and have original maturities of three months or less.
Allowance for Doubtful Accounts
Estimated losses on accounts receivable are provided through an allowance for doubtful accounts. We estimate the allowance for doubtful accounts through various procedures, including extensive review of our trade receivable balances by counterparty, assessing economic events and conditions, our historical experience with counterparties, the counterparty’s financial condition and the amount and age of past due accounts.
We continuously evaluate our ability to collect amounts owed to us. Receivables are considered past due if full payment is not received by the contractual due date. Our evaluation procedures also include performing account reconciliations, dispute resolution and payment confirmation.
As the financial condition of any counterparty changes, circumstances develop or additional information becomes available, adjustments to our allowance may be required.
Inventories
Our inventories consist primarily of NGL product inventories, which are valued at the lower of cost or net realizable value, using the average cost method. Most NGL product inventories turn over monthly, but some inventory, primarily propane, is acquired and held during the year to meet anticipated heating season requirements of our customers. Commodity inventories that are not physically or contractually available for sale under normal operations (“deadstock”) are included in Property, Plant and Equipment. Our commodity-based inventory was $
Product Exchanges
Exchanges of NGL products are executed to satisfy timing and logistical needs of the exchange parties. Volumes received and delivered under exchange agreements are recorded as inventory. If the locations of receipt and delivery are in different markets, an exchange differential may be billed or owed. The exchange differential is recorded as either accounts receivable or accrued liabilities.
Gas Processing Imbalances
Quantities of natural gas and/or NGLs over-delivered or under-delivered, related to certain gas plant operational balancing agreements, are recorded monthly as inventory or as a payable using the weighted average price at the time the imbalance was created. Inventory imbalances receivable are valued at the lower of cost or net realizable value using the average cost method; inventory imbalances payable are valued at replacement cost. These imbalances are settled either by current cash-out settlements or by adjusting future receipts or deliveries of natural gas or NGLs.
F-11
Derivative Instruments
We utilize derivative instruments to manage the volatility of our cash flows due to fluctuating energy commodity prices. For balance sheet classification purposes, we analyze the fair values of the derivative instruments on a contract by contract basis and report the related fair values and any related collateral by counterparty on a gross basis. Cash flows from derivative instruments designated as hedges are recognized in the same financial statement line item as the cash flows from the respective item being hedged.
We formally document all relationships between hedging instruments and hedged items, as well as its risk management objectives and strategy for undertaking the hedge. This documentation includes the specific identification of the hedging instrument and the hedged item, the nature of the risk being hedged and the manner in which the hedging instrument’s effectiveness will be assessed. At the inception of the hedge and on an ongoing basis, we assess whether the derivatives used in hedging transactions are highly effective in achieving the offset of changes in cash flows attributable to the hedged risk.
We record all derivative instruments at fair value with the exception of those that we apply the normal purchases and normal sales election.
The table below summarizes the accounting treatment for our derivative instruments, and the impact on our consolidated financial statements:
|
Recognition and Measurement |
||
|
Derivative Treatment |
Balance Sheet |
Income Statement |
|
Normal Purchases and Normal Sales |
Fair value not recorded |
Earnings recognized when volumes are physically delivered or received |
|
Mark-to-Market |
Recorded at fair value |
Change in fair value recognized currently in earnings |
|
Cash Flow Hedge |
Recorded at fair value with changes in fair value deferred in Accumulated Other Comprehensive Income ("AOCI") |
The gain/loss on the derivative instrument is reclassified out of AOCI into earnings when the forecasted transaction occurs |
We will discontinue hedge accounting on a prospective basis when a hedge instrument is terminated, ceases to be highly effective or the forecasted transaction is no longer probable to occur. Gains and losses deferred in AOCI related to cash flow hedges for which hedge accounting has been discontinued remain deferred until the forecasted transaction occurs. If it is probable that a hedged forecasted transaction will not occur, deferred gains or losses on the hedging instrument are reclassified to earnings immediately.
Property, Plant and Equipment
Property, plant and equipment is recorded at acquisition cost less accumulated depreciation. Depreciation is computed using the straight-line method over the estimated useful lives of the assets. The determination of the useful lives of property, plant and equipment requires us to make various assumptions, including our expected use of the asset and the supply of and demand for hydrocarbons in the markets served, normal wear and tear of the facilities, and the extent and frequency of maintenance programs. Upon disposition or retirement of property, plant and equipment, any gain or loss is recorded to operations.
Expenditures for routine maintenance and repairs are expensed as incurred. Expenditures to refurbish an asset that increases its existing service potential or prevents environmental contamination are capitalized and depreciated over the remaining useful life of the asset or major asset component. Certain costs directly related to the construction of assets, including internal labor costs, interest and engineering costs, are capitalized.
Impairment of Long-Lived Assets
We evaluate long-lived assets, including intangible assets, for impairment when events or changes in circumstances indicate our carrying amount of an asset may not be recoverable, including changes to our estimates that could have an impact on our assessment of asset recoverability. Asset recoverability is measured by comparing the carrying value of the asset or asset group with its expected future pre-tax undiscounted cash flows. Individual assets are grouped at the lowest level for which the related identifiable cash flows are largely independent of the cash flows of other assets and liabilities. These cash flow estimates require us to make judgments and assumptions related to operating and cash flow results, economic obsolescence, the business climate, contractual, legal and other factors.
F-12
If the carrying amount exceeds the expected future undiscounted cash flows, we recognize a non-cash pre-tax impairment loss equal to the excess of net book value over fair value as determined by quoted market prices in active markets or present value techniques if quotes are unavailable. The estimated cash flows used to assess recoverability of our long-lived assets and measure fair value of our asset groups are derived from current business plans, which are developed using near-term price and volume projections reflective of the current environment and management's projections for long-term average prices and volumes. In addition to near and long-term price assumptions, other key assumptions include volume projections, operating costs, timing of incurring such costs, and the use of an appropriate terminal value and discount rate. Any changes we make to these projections and assumptions could result in significant revisions to our evaluation of recoverability of our long-lived assets and the recognition of additional impairments. We believe our estimates and models used to determine fair value are similar to what a market participant would use.
Goodwill
Goodwill is a residual intangible asset that results when the cost of an acquisition exceeds the fair value of the net identifiable assets of the acquired business. Goodwill is not subject to amortization but is tested for impairment at least annually. This test requires us to attribute goodwill to an appropriate reporting unit, which is an operating segment or one level below an operating segment (also known as a component). We evaluate goodwill for impairment on November 30 of each year, or whenever impairment indicators are present. Prior to us conducting the goodwill impairment test, we complete a review of the carrying values of our long-lived assets, including property, plant and equipment and other intangible assets. If it is determined that the carrying values are not recoverable, we reduce the carrying values of the long-lived assets pursuant to our policy on property, plant and equipment.
As part of our goodwill impairment test, we may first assess qualitative factors to determine if the quantitative goodwill impairment test is necessary. If we choose to bypass this qualitative assessment or determine that a goodwill impairment test is required, our annual goodwill impairment test is performed by comparing the fair value of a reporting unit with its carrying amount (including attributed goodwill). We recognize an impairment loss in our Consolidated Statements of Operations and a corresponding reduction of goodwill on our Consolidated Balance Sheets for the amount by which the carrying amount exceeds the reporting unit’s fair value. The goodwill impairment loss will not exceed the total amount of goodwill allocated to that reporting unit. Additionally, when measuring goodwill, we consider income tax effects from any tax deductible goodwill on the carrying amount of the reporting unit, if applicable.
Intangible Assets
Our intangible assets include producer dedications under long-term contracts and customer relationships associated with business and asset acquisitions. The fair value of these acquired intangible assets was determined at the date of acquisition based on the present value of estimated future cash flows. We amortize the costs of our assets in a manner that closely resembles the expected benefit pattern of the intangible assets or on a straight-line basis, where such pattern is not readily determinable, over the periods in which we benefit from services provided to customers.
Asset Retirement Obligations
Asset retirement obligations (“AROs”) are legal obligations associated with the retirement of tangible long-lived assets that result from their acquisition, construction, development and/or normal operation. We record a liability and increase the basis in the underlying asset for the present value of each expected asset retirement obligation (“ARO”) when there is a legal obligation to settle under existing or enacted law, statute, written or oral contract or by legal construction.
Our obligations are estimated based on discounted cash flow estimates. Over time, the ARO liability is accreted to its present value as a period cost and the capitalized amount is depreciated over the asset’s respective useful life. At least annually, we review the projected timing and amount of asset retirement obligations and reflect revisions as an increase or decrease in the carrying amount of the liability and the basis in the underlying asset. Upon settlement, we will recognize any difference between the recorded amount and the actual settlement cost as a gain or loss.
Debt Issuance Costs
Costs incurred in connection with the issuance of long-term debt and any original issue discount or premium are deferred and charged to interest expense over the term of the related debt. Debt issuance costs related to revolving credit facilities are presented as other long-term assets, and debt issuance costs related to long-term debt obligations with scheduled maturities are reflected as a deduction to the carrying amount of long-term debt on the Consolidated Balance Sheets. Gains or losses on debt repurchases, redemptions and debt extinguishments include any associated unamortized debt issuance costs.
F-13
Accounts Receivable Securitization Facility
Proceeds from the sale or contribution of certain receivables under the accounts receivable securitization facility (the “Securitization Facility”) are treated as collateralized borrowings in our financial statements. Proceeds and repayments under the Securitization Facility are reflected as cash flows from financing activities in our Consolidated Statements of Cash Flows.
Environmental Liabilities and Other Loss Contingencies
We accrue a liability for loss contingencies, including environmental remediation costs arising from claims, assessments, litigation, fines, penalties and other sources, when the loss is probable and reasonably estimable.
Income Taxes
We generally are not subject to federal income taxes. For federal income tax purposes, our earnings or losses are included in the tax returns of our separate partners. The taxable income or loss passed through to our partners may vary substantially from the net income or net loss we report in the Consolidated Statements of Operations.
As part of the APL merger, we acquired TPL Arkoma, Inc. a corporate subsidiary subject to federal and state income tax. Our corporate subsidiary accounts for income taxes using the asset and liability method and provides deferred income taxes for all significant temporary differences.
As part of the process of preparing our consolidated financial statements, we are required to estimate our income taxes for our taxable corporate subsidiary. This process involves estimating our actual current tax payable and related tax expense together with assessing temporary differences resulting from differing treatment of certain items, such as depreciation, for tax and accounting purposes. These differences can result in deferred tax assets and liabilities, which are included within our Consolidated Balance Sheets.
We must then assess the likelihood that our deferred tax assets will be recovered from future taxable income. If we believe that it is more likely than not (a likelihood of more than 50%) that some portion or all of the deferred tax assets will not be realized, we establish a valuation allowance. Any change in the valuation allowance would impact our income tax provision and net income in the period in which such a determination is made. We consider all available evidence to determine whether, based on the weight of the evidence, a valuation allowance is needed. Evidence used includes information about our current financial position and our results of operations for the current and preceding years, as well as all currently available information about future years, including our anticipated future performance, the reversal of deferred tax liabilities and tax planning strategies.
The effective tax rate differs from the statutory rate due primarily to Partnership earnings that are generally not subject to federal and state income taxes at the Partnership level. We are also subject to the Texas margin tax, consisting generally of a
Mandatorily Redeemable Preferred Interests
Mandatorily redeemable preferred interests are included in other long-term liabilities on our Consolidated Balance Sheets, and such interests with multiple or indeterminate redemption dates are reported at their estimated redemption value as of the reporting date. This point-in-time value does not represent the amount that ultimately would be redeemed in the future. Changes in the redemption value are included in interest expense, net in our Consolidated Statements of Operations.
Our consolidated financial statements include our interest in
F-14
The joint ventures, collectively, hold $
In February 2018, the parties amended the agreements governing each joint venture to: (i) increase the priority return for capital contributions made on or after January 1, 2017; and (ii) add a non-consent feature effective with respect to certain capital projects undertaken on or after January 1, 2017. During the year ended December 31, 2018, the decrease in estimated redemption value of the mandatorily redeemable preferred interests of $
Comprehensive Income
Comprehensive income includes net income and other comprehensive income (“OCI”), which includes changes in the fair value of derivative instruments that are designated as cash flow hedges.
Revenue Recognition
Our operating revenues are primarily derived from the following activities:
|
|
• |
sales of natural gas, NGLs, condensate and crude oil; |
|
|
• |
services related to compressing, gathering, treating, and processing of natural gas; and |
|
|
• |
services related to NGL fractionation, terminaling and storage, transportation and treating. |
We have multiple types of contracts with commercial counterparties and many of these contracts contain embedded fees with settlement provisions that deduct these fees from the sales price paid by Targa in exchange for commodities. The commercial relationship of the counterparty in such contracts is inherently one of a supplier, rather than a customer, and therefore, such contracts are excluded from the provisions of the revenue recognition guidance in Topic 606, Revenue from Contracts with Customers. Any cash inflows or fees that are realized on these supply type contracts are reported as a reduction of Product purchases.
Our revenues, therefore, are measured based on consideration specified in a contract with parties designated as customers. We recognize revenue when we satisfy a performance obligation by transferring control over a commodity or service to a customer. Sales and other taxes we collect, that are both imposed on and concurrent with revenue-producing activities, are excluded from revenues.
We generally report sales revenues on a gross basis in our Consolidated Statements of Operations, as we typically act as the principal in the transactions where we receive and control commodities. However, buy-sell transactions that involve purchases and sales of inventory with the same counterparty, which are legally contingent or in contemplation of one another, as well as other instances where we do not control the commodities, but rather are acting as an agent to the supplier, are reported as a single revenue transaction on a combined net basis.
Our commodity sales contracts typically contain multiple performance obligations, whereby each distinct unit of commodity to be transferred to the customer is a separate performance obligation. Under such contracts, revenue is recognized at the point in time each unit is transferred to the customer because the customer is able to direct the use of, and obtain substantially all of the remaining benefits from, the commodity at that time. In certain instances, it may be determinable that the customer receives and consumes the benefits of each unit as it is transferred. Under such contracts, we have a single performance obligation comprised of a series of distinct units of commodity; and in such instance, revenue is recognized over time using the units delivered output method, as each distinct unit is transferred to the customer. Our commodity sales contracts are typically priced at a market index, but may also be set at a fixed price. When our sales are priced at a market index, we apply the allocation exception for variable consideration and allocate the market price to each distinct unit when it is transferred to the customer. The fixed price in our commodity sales contracts generally represents the standalone selling price, and therefore, when each distinct unit is transferred to the customer, we recognize revenue at the fixed price.
F-15
Our service contracts typically contain a single performance obligation. The underlying activities performed by us are considered inputs to an integrated service and not separable because such activities in combination are required to successfully transfer the single overall service that the customer has contracted for and expects to receive. Therefore, the underlying activities in such contracts are not considered to be distinct services. However, in certain instances, the customer may contract for additional distinct services and therefore additional performance obligations may exist. In such instances, the transaction price is allocated to the multiple performance obligations based on their relative standalone selling prices. The performance obligation(s) in our service contracts is a series of distinct days of the applicable service over the life of the contract (fundamentally a stand-ready service), whereby we recognize revenue over time using an output method of progress based on the passage of time (i.e., each day of service). This output method is appropriate because it directly relates to the value of service transferred to the customer to date, relative to the remaining days of service promised under the contract.
The transaction price for our service contracts is typically comprised of variable consideration, which is primarily dependent on the volume and composition of the commodities delivered and serviced. The variable consideration is generally commensurate with our efforts to perform the service and the terms of the variable payments relate specifically to our efforts to satisfy each day of distinct service. Therefore, the variable consideration is typically not estimated at contract inception, but rather the allocation exception for variable consideration is applied, whereby the variable consideration is allocated to each day of service and recognized as revenue when each day of service is provided. When we are entitled to noncash consideration in the form of commodities, the variability related to the form of consideration (market price) and reasons other than form (volume and composition) are interrelated to the service, and therefore, we measure the noncash consideration at the point in time when the volume, mix and market price related to the commodities retained in-kind are known. This results in the recognition of revenue based on the market price of the commodity when the service is performed. In addition, if the transaction price includes a fixed component (i.e., a fixed capacity reservation fee), the fixed component is recognized ratably on a straight line basis over the contract term, as each day of service has elapsed, which is consistent with the output method of progress selected for the performance obligation.
Our customers are typically billed on a monthly basis, or earlier, if final delivery and sale of commodities is made prior to month-end, and payment is typically due within 10 to 30 days. As a practical matter, we define the unit of account for revenue recognition purposes based on the passage of time ranging from one month to one quarter, rather than each day. This is because the financial reporting outcome is the same regardless of whether each day or month/quarter is treated as the distinct service in the series. That is, at the end of each month or quarter, the variability associated with the amount of consideration for which we are entitled to, is resolved, and can be included in that month or quarter’s revenue.
We have certain long-term contractual arrangements under which we have received consideration, but for which all conditions for revenue recognition have not been met. These arrangements result in deferred revenue, which will be recognized over the periods that performance will be provided.
Significant Judgments
Certain provisions of our service contracts (i.e., tiered price structures) require further assessment to determine if the allocation exception for variable consideration is met. If the allocation exception is not met, we estimate the total consideration that we expect to be entitled to for the applicable term of the contract, based on projections of future activity. In such instance, revenue is recognized using an output method of progress based on the volume of commodities serviced during the reporting period. Our estimate of total consideration is reassessed each reporting period until contract completion.
For contracts with minimum volume commitments, we generally expect the customer to meet the commitment. However, such contracts are reassessed throughout the term of the commitment, and if we no longer expect the customer to meet the commitment, the allocation exception for variable consideration would not be met. That is, from that point onwards, an allocation based on the applicable fee applied to the volumes serviced does not depict the amount of consideration which we expect to be entitled to, in exchange for the service. In such instance, revenue will be recognized up to the minimum volume commitment in proportion to the days of service elapsed and the remaining duration of the commitment.
Contract Assets
We classify our contract assets as receivables because we generally have an unconditional right to payment for the commodities sold or services performed at the end of reporting period.
Unit-Based and Share-Based Compensation
F-16
Prior to the TRC/TRP Merger, we awarded unit-based compensation to employees of Targa and to directors and non-management directors of our General Partner in the form of restricted common units and performance units. We withheld units to satisfy employees’ tax withholding obligations on vested awards. The withheld shares were recorded as treasury units at cost. In connection with the TRC/TRP Merger, the unit-based compensation was converted to comparable share-based TRC awards and share-based compensation is now awarded in the form of TRC restricted stock, and TRC restricted stock units. Compensation expense on awards that qualify as equity arrangements are measured by the fair value of the award as determined at the date of grant. Compensation expense on awards that qualify as liability arrangements is initially measured by the fair value of the award at the date of grant, and re-measured subsequently at each reporting date through the settlement period. Compensation expense is allocated to us from TRC and recognized in general and administrative expense over the requisite service period of each award.
Leases
We recognize the following for all leases (with the exception of short-term leases) at the commencement date:
|
|
• |
A lease liability, which is a lessee’s obligation to make lease payments arising from a lease. |
|
|
• |
A right-of-use asset, which is an asset that represents the lessee’s right to use, or control the use of, a specified asset for the lease term. |
We determine if an arrangement is or contains a lease at inception. Leases with an initial term of twelve months or less are considered short-term leases, which are excluded from the balance sheet. Right-of-use assets and lease liabilities are recognized at the commencement date based on the present value of future lease payments over the lease term. The right-of-use asset also includes any lease prepayments and excludes lease incentives. As most of the Company’s leases do not provide an implicit interest rate, we use our incremental borrowing rate as the discount rate to compute the present value of our lease liability. The discount rate applied is determined based on information available on the date of adoption for all leases existing as of that date, and on the date of lease commencement for all subsequent leases.
Our lease arrangements may include variable lease payments based on an index or market rate, or may be based on performance. For variable lease payments based on an index or market rate, we estimate and apply a rate based on information available at the commencement date. Variable lease payments based on performance are excluded from the calculation of the right-of-use asset and lease liability, and are recognized in our Consolidated Statements of Operations when the contingency underlying such variable lease payments is resolved. Our lease terms may include options to extend or terminate the lease. Such options are included in the measurement of our right-of-use asset and liability, provided we determine that we are reasonably certain to exercise the option.
Note 4 – Joint Ventures and Divestitures
Joint Ventures
Little Missouri 4 Joint Venture
In January 2018, we formed a 50/
F-17
DevCo Joint Ventures
In February 2018, we formed
The following diagram displays the ownership structure of the DevCo JVs:
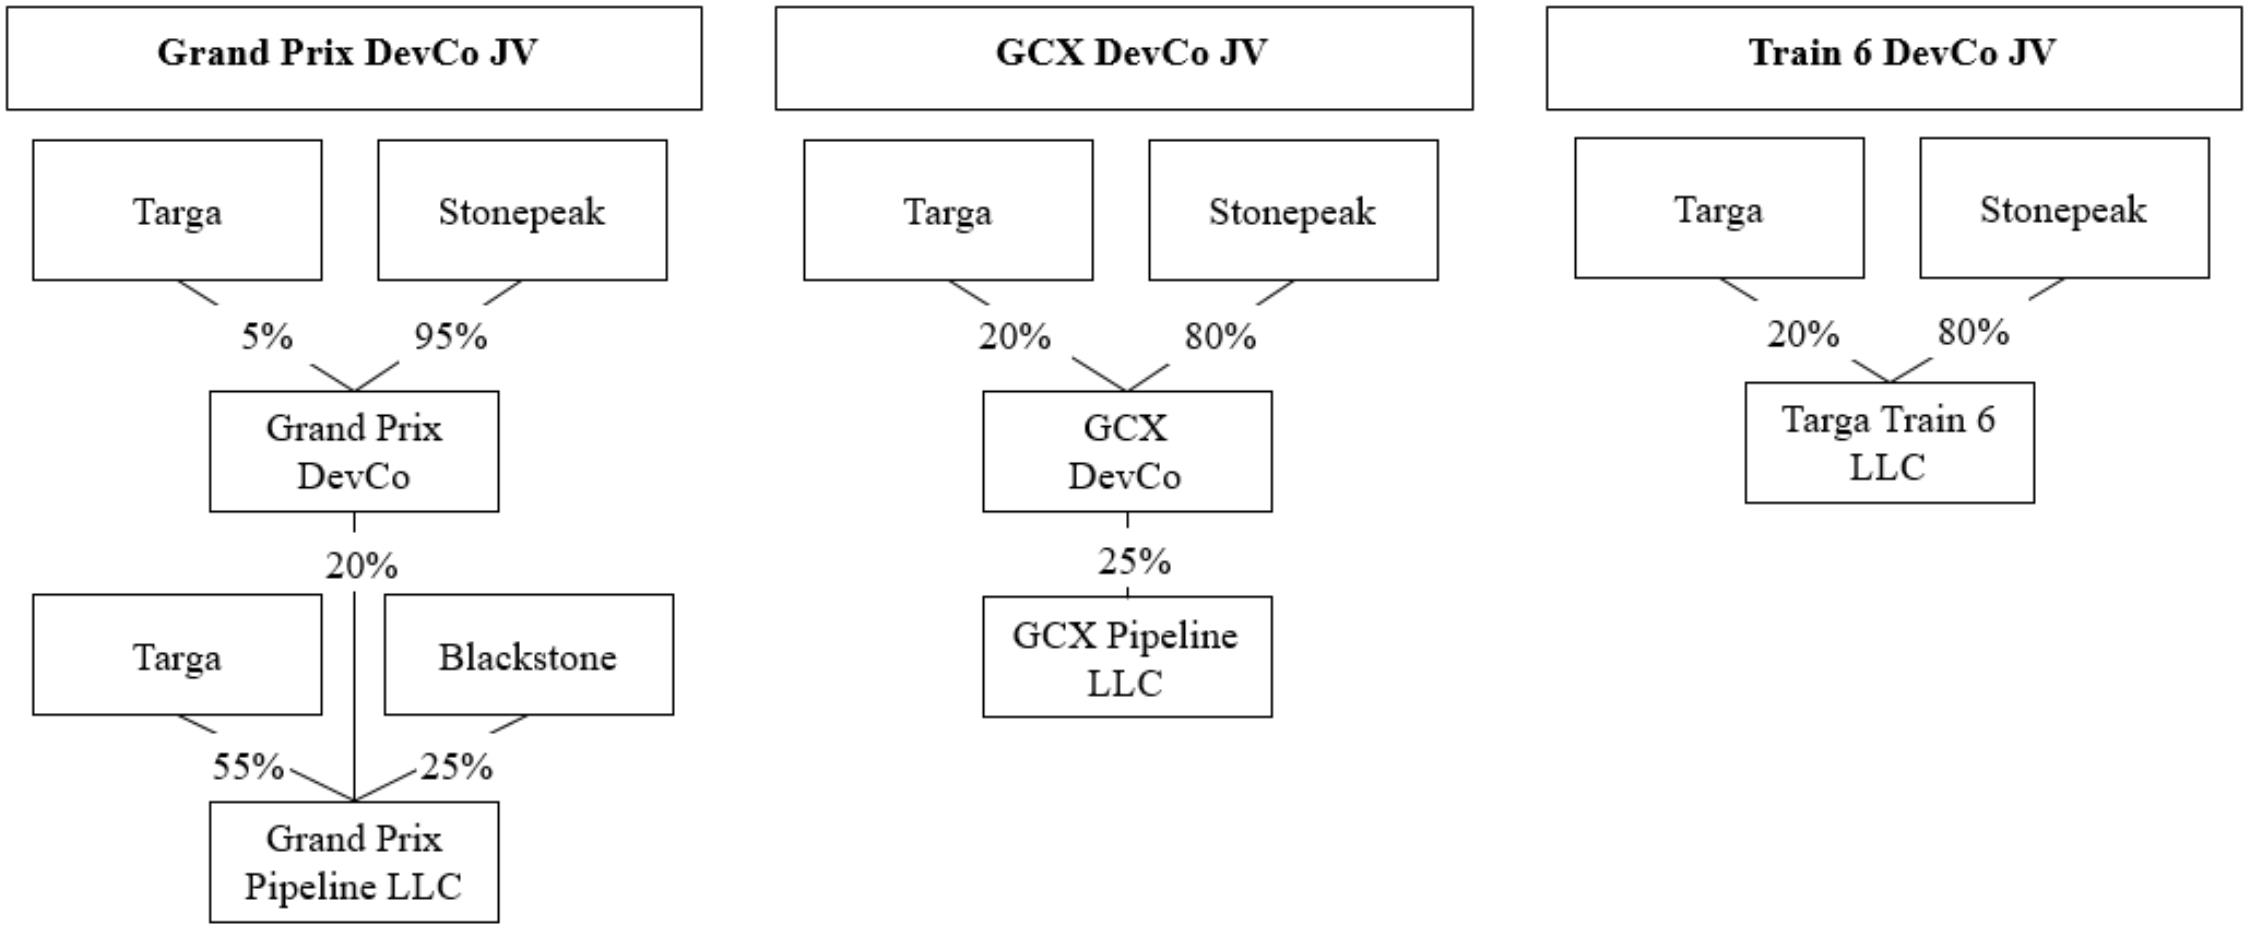
For a four-year period beginning on the date that all three projects commenced commercial operations, we have the option to acquire all or part of Stonepeak’s interests in the DevCo JVs. Targa may acquire up to
We hold a controlling interest in each of the DevCo JVs, as we have the majority voting interest and the supermajority voting provisions of the joint venture agreements do not represent substantive participating rights and are protective in nature to Stonepeak. As a result, we have consolidated each of the DevCo JVs in our financial statements. We continue to account for the Grand Prix Joint Venture on a consolidated basis in our consolidated financial statements, and continue to account for GCX as an equity method investment as disclosed in Note 7 – Investments in Unconsolidated Affiliates.
Carnero Joint Venture
In May 2018, we merged our
F-18
Divestitures
Sale of Inland Marine Barges Business
In May 2018, we sold our inland marine barge business, which was included in our Logistics and Transportation segment, to a third party for $
Sale of Refined Products and Crude Oil Storage and Terminaling Facilities
In September 2018, we executed agreements to sell our Downstream refined products and crude oil storage and terminaling facilities in Tacoma, Washington, and Baltimore, Maryland, to a third party for approximately $
Sale of Versado Gathering System
In December 2018, we exchanged a portion of our Versado gathering system, located primarily in Yoakum County, Texas, and Lea County, New Mexico, and associated contracts and assets, with a third party for consideration that includes 1) a gathering system located primarily in Lea County, New Mexico, and associated contracts and assets, 2) an initial cash payment and 3) deferred payments due semi-annually beginning on June 30, 2019, through December 31, 2022. We later agreed to accept a lump sum payment from the third party in October 2019 to satisfy the third party’s payment obligations. The acquired gathering system has been integrated into the Versado gathering system. Due to the significant monetary portion of the consideration received, the exchange of these assets was accounted for as a derecognition of nonfinancial assets, and a gain of $
Sale of Interest in Train 7
In February 2019, we announced an extension of the Grand Prix from Southern Oklahoma to the STACK region of Central Oklahoma where it will connect with the Williams Companies, Inc. (“Williams”) Bluestem Pipeline and link the Conway, Kansas, and Mont Belvieu, Texas, NGL markets. In connection with this project, Williams has committed significant volumes to us that we will transport on Grand Prix and fractionate at our Mont Belvieu facilities. Williams also exercised its option to acquire a
Sale of Interest in Targa Badlands LLC
In April 2019, we closed on the sale of a
F-19
We continue to be the operator of Targa Badlands and hold majority governance rights. As a result, we continue to present Targa Badlands on a consolidated basis in our consolidated financial statements and GSO’s contributions are reflected as noncontrolling interests. The sale of interest in Targa Badlands is included in our Gathering and Processing segment. Targa Badlands is a discrete entity and the assets and credit of Targa Badlands are not available to satisfy the debts and other obligations of Targa or its other subsidiaries.
Sale of Delaware Crude System
In January 2020, we closed on the sale of our Delaware crude system for approximately $
Sale of Assets in Channelview, Texas
In October 2020, we closed on the sale of our assets in Channelview, Texas for approximately $
Note 5 — Property, Plant and Equipment and Intangible Assets
Property, Plant and Equipment
|
|
|
December 31, 2020 |
|
|
December 31, 2019 |
|
|
Estimated Useful Lives (In Years) |
||
|
Gathering systems |
|
$ |
|
|
|
$ |
|
|
|
|
|
Processing and fractionation facilities |
|
|
|
|
|
|
|
|
|
|
|
Terminaling and storage facilities |
|
|
|
|
|
|
|
|
|
|
|
Transportation assets |
|
|
|
|
|
|
|
|
|
|
|
Other property, plant and equipment |
|
|
|
|
|
|
|
|
|
|
|
Land |
|
|
|
|
|
|
|
|
|
— |
|
Construction in progress |
|
|
|
|
|
|
|
|
|
— |
|
Finance lease right-of-use assets |
|
|
|
|
|
|
|
|
|
|
|
Property, plant and equipment |
|
|
|
|
|
|
|
|
|
|
|
Accumulated depreciation, amortization and impairment |
|
|
( |
) |
|
|
( |
) |
|
|
|
Property, plant and equipment, net |
|
$ |
|
|
|
$ |
|
|
|
|
|
|
|
|
|
|
|
|
|
|
|
|
|
Intangible assets |
|
$ |
|
|
|
$ |
|
|
|
|
|
Accumulated amortization and impairment |
|
|
( |
) |
|
|
( |
) |
|
|
|
Intangible assets, net |
|
$ |
|
|
|
$ |
|
|
|
|
During the preparation of the Company's 2020 consolidated financial statements, the Company identified certain gathering pipelines that should not have had value ascribed to them as part of a prior acquisition as these assets were inactive. The Company does not believe this error is material to its previously issued historical consolidated financial statements for any of the periods impacted and accordingly, has not adjusted the historical financial statements. The Company wrote these assets down in 2020 and recognized a non-cash loss of $
During the preparation of the Company's first quarter 2019 consolidated financial statements, the Company identified an error related to depreciation expense on certain assets that should have been placed in-service during 2018. The Company does not believe this error is material to its previously issued historical consolidated financial statements for any of the periods impacted and accordingly, has not adjusted the historical financial statements. The Company recorded the cumulative impact of a one-time $
For each of the years ended December 31, 2020, 2019 and 2018 depreciation expense was $
F-20
Impairments of Long-Lived Assets
We review and evaluate our long-lived assets, including intangible assets, for impairment when events or changes in circumstances indicate that the related carrying amount of such assets may not be recoverable, including changes to our estimates that could have an impact on our assessment of asset recoverability.
During the first quarter of 2020, global commodity prices declined due to factors that significantly impacted both demand and supply. As the COVID-19 pandemic spread, causing travel and other restrictions to be implemented globally, the demand for commodities declined. Additionally, the supply shock late in the first quarter from certain major oil producing nations increasing production also significantly contributed to the sharp drop in commodity prices. The drop in commodity prices resulted in prompt reactions from some domestic producers, including significantly reducing capital budgets and resultant drilling activity and shutting-in production. As a result, we determined that indicators of impairment existed for certain asset groups reported primarily within our Gathering and Processing segment, and recorded non-cash pre-tax impairments of $
While commodity prices remain low relative to historical levels and uncertainties associated with the impacts of COVID-19 continue, production from wells that were previously shut-in during the first half of 2020 across our operating areas has largely resumed. There were
In the fourth quarter of 2019, we recorded a non-cash pre-tax impairment charge of $
For both the 2020 and 2019 impairment assessments discussed above, we determined fair value through the use of discounted estimated cash flows to measure the impairment loss for each asset group for which undiscounted future net cash flows were not sufficient to recover the net book value. The estimated cash flows used to assess recoverability of our long-lived assets and measure fair value of our asset groups are derived from current business plans, which are developed using near-term price and volume projections reflective of the current environment and management's projections for long-term average prices and volumes. In addition to near and long-term price assumptions, other key assumptions include volume projections, operating costs, timing of incurring such costs, and the use of an appropriate terminal value and discount rate. We believe our estimates and models used to determine fair value are similar to what a market participant would use.
The fair value measurement of our long-lived assets was based, in part, on significant inputs not observable in the market (as discussed above) and thus represents a Level 3 measurement. The significant unobservable inputs used include discount rates and determination of terminal values. We utilized a weighted average discount rate of
We may identify additional triggering events in the future, which will require additional evaluations of the recoverability of the carrying value of our long-lived assets and may result in future impairments.
Intangible Assets
Intangible assets consist of customer contracts and customer relationships acquired in prior business combinations. The fair value of these acquired intangible assets were determined at the date of acquisition based on the present values of estimated future cash flows. Amortization expense attributable to these assets is recorded over the periods in which we benefit from services provided to customers.
As a result of the triggering events and analysis described above, in the first quarter of 2020, we recognized a non-cash pre-tax impairment loss associated with certain intangible customer relationships for which undiscounted future net cash flows were not sufficient to recover the net book value.
F-21
For each of the years ended December 31, 2020, 2019 and 2018 amortization expense for our intangible assets was $
The changes in our intangible assets are as follows:
|
|
|
December 31, 2020 |
|
|
December 31, 2019 |
|
||
|
Balance at beginning of period |
|
$ |
|
|
|
$ |
|
|
|
Held for sale assets |
|
|
— |
|
|
|
( |
) |
|
Impairment |
|
|
( |
) |
|
|
— |
|
|
Amortization |
|
|
( |
) |
|
|
( |
) |
|
Balance at end of period |
|
$ |
|
|
|
$ |
|
|
Note 6 – Goodwill
We recognized goodwill of approximately $
At December 31, 2020, we had $
|
|
|
New Midland |
|
|
New Delaware |
|
|
Delaware Supersystem |
|
|
Permian Midland |
|
|
Permian Delaware |
|
|
Total |
|
||||||
|
Balance as of December 31, 2018: |
|
|
|
|
|
|
|
|
|
|
|
|
|
|
|
|
|
|
|
|
|
|
|
|
|
Goodwill |
|
$ |
|
|
|
$ |
|
|
|
$ |
— |
|
|
$ |
— |
|
|
$ |
— |
|
|
$ |
|
|
|
Accumulated impairment losses |
|
|
— |
|
|
|
— |
|
|
|
— |
|
|
|
— |
|
|
|
— |
|
|
|
— |
|
|
Net |
|
|
|
|
|
|
|
|
|
|
— |
|
|
|
— |
|
|
|
— |
|
|
|
|
|
|
|
|
|
|
|
|
|
|
|
|
|
|
|
|
|
|
|
|
|
|
|
|
|
|
|
|
Impairment |
|
|
— |
|
|
|
— |
|
|
|
— |
|
|
|
— |
|
|
|
— |
|
|
|
— |
|
|
Reporting unit aggregation (1) |
|
|
— |
|
|
|
( |
) |
|
|
|
|
|
|
— |
|
|
|
— |
|
|
|
— |
|
|
|
|
|
|
|
|
|
|
|
|
|
|
|
|
|
|
|
|
|
|
|
|
|
|
|
|
Balance as of December 31, 2019: |
|
|
|
|
|
|
|
|
|
|
|
|
|
|
|
|
|
|
|
|
|
|
|
|
|
Goodwill |
|
|
|
|
|
|
— |
|
|
|
|
|
|
|
— |
|
|
|
— |
|
|
|
|
|
|
Goodwill allocated to held for sale assets |
|
|
— |
|
|
|
— |
|
|
|
( |
) |
|
|
— |
|
|
|
— |
|
|
|
( |
) |
|
Accumulated impairment losses |
|
|
— |
|
|
|
— |
|
|
|
— |
|
|
|
— |
|
|
|
— |
|
|
|
— |
|
|
Net |
|
|
|
|
|
|
— |
|
|
|
|
|
|
|
— |
|
|
|
— |
|
|
|
|
|
|
|
|
|
|
|
|
|
|
|
|
|
|
|
|
|
|
|
|
|
|
|
|
|
|
|
|
Impairment |
|
|
— |
|
|
|
— |
|
|
|
— |
|
|
|
— |
|
|
|
— |
|
|
|
— |
|
|
Reporting unit aggregation (2) |
|
|
( |
) |
|
|
— |
|
|
|
( |
) |
|
|
|
|
|
|
|
|
|
|
— |
|
|
|
|
|
|
|
|
|
|
|
|
|
|
|
|
|
|
|
|
|
|
|
|
|
|
|
|
Balance as of December 31, 2020: |
|
|
|
|
|
|
|
|
|
|
|
|
|
|
|
|
|
|
|
|
|
|
|
|
|
Goodwill |
|
|
— |
|
|
|
— |
|
|
|
— |
|
|
|
|
|
|
|
|
|
|
|
|
|
|
Accumulated impairment losses |
|
|
— |
|
|
|
— |
|
|
|
— |
|
|
|
— |
|
|
|
— |
|
|
|
— |
|
|
Net |
|
$ |
— |
|
|
$ |
— |
|
|
$ |
— |
|
|
$ |
|
|
|
$ |
|
|
|
$ |
|
|
|
(1) |
In 2019, we began aggregating the results of Delaware Supersystem activity, including New Delaware. Discrete financial information for New Delaware is no longer available and management now reviews aggregate Delaware Supersystem operating results. |
|
(2) |
In 2020, as a result of the high degree of operational integration of our Permian gathering and processing assets and management’s increased focus and review of combined operating results within our Permian Midland and Permian Delaware regions, we further aggregated our New Midland and Permian Supersystem reporting units into the Permian Midland and Permian Delaware reporting units, respectively. |
F-22
The future cash flows and resulting fair values of these reporting units are sensitive to changes in crude oil, natural gas and NGL prices. The direct and indirect effects of significant declines in commodity prices from the date of acquisition would likely cause the fair values of these reporting units to fall below their carrying values, and could result in an impairment of goodwill.
As described in Note 3 – Significant Accounting Policies, we evaluate goodwill for impairment at least annually on November 30, or more frequently if we believe necessary based on events or changes in circumstances. For our 2020 annual evaluation, we performed a qualitative assessment, which indicated that it is not more likely than not that the fair values of the Permian Midland and Permian Delaware reporting units were less than their carrying amounts and therefore, a quantitative goodwill impairment test was not necessary. Our qualitative assessment considered, among other things, the overall financial performance and future outlook of the Permian Midland and Permian Delaware reporting units, industry and market considerations, and other relevant entity specific events. We did
Our 2018 annual evaluation of goodwill for impairment was completed in the fourth quarter of 2018. Due to the impact of lower forecasted commodity prices and a reduction in forecasted volumes as a result of changes in producers’ drilling activity, we recorded impairment expense of $
Our annual quantitative evaluations in 2019 and 2018 utilized an income approach including a terminal value to estimate the fair values of our reporting units based on a DCF analysis. The future cash flows for our reporting units are based on our estimates, at that time, of future revenues, income from operations and other factors, such as working capital and timing of capital expenditures. We take into account current and expected industry and market conditions, including commodity pricing and volumetric forecasts in the basins in which the reporting units operate. The discount rates used in our DCF analysis are based on a weighted average cost of capital determined from relevant market comparisons.
The fair value measurements utilized for the evaluation of goodwill for impairment are based on inputs that are not observable in the market and therefore represent Level 3 inputs, as defined in Note 18 – Fair Value Measurements. These inputs require significant judgments and estimates at the time of valuation.
Note 7 – Investments in Unconsolidated Affiliates
Our investments in unconsolidated affiliates consist of the following:
Gathering and Processing Segment
|
|
• |
|
|
|
• |
a |
Logistics and Transportation Segment
|
|
• |
a |
|
|
• |
a |
|
|
• |
a |
The terms of these joint venture agreements do not afford us the degree of control required for consolidating them in our consolidated financial statements, but do afford us the significant influence required to employ the equity method of accounting.
See Note 4 – Joint Ventures and Divestitures for further discussion of GCX and Little Missouri 4.
F-23
The following table shows the activity related to our investments in unconsolidated affiliates:
|
|
|
Balance at December 31, 2017 |
|
|
Equity Earnings (Loss) |
|
|
Cash Distributions (1) |
|
|
Acquisition (Disposition) |
|
|
Contributions (2) |
|
|
Balance at December 31, 2018 |
|
||||||
|
GCX (3) |
|
$ |
— |
|
|
$ |
|
|
|
$ |
— |
|
|
$ |
— |
|
|
$ |
|
|
|
$ |
|
|
|
Little Missouri 4 |
|
|
— |
|
|
|
— |
|
|
|
( |
) |
|
|
— |
|
|
|
|
|
|
|
|
|
|
T2 Eagle Ford |
|
|
|
|
|
|
( |
) |
|
|
— |
|
|
|
— |
|
|
|
— |
|
|
|
|
|
|
T2 LaSalle |
|
|
|
|
|
|
( |
) |
|
|
— |
|
|
|
— |
|
|
|
|
|
|
|
|
|
|
GCF |
|
|
|
|
|
|
|
|
|
|
( |
) |
|
|
— |
|
|
|
— |
|
|
|
|
|
|
Cayenne |
|
|
|
|
|
|
|
|
|
|
( |
) |
|
|
— |
|
|
|
|
|
|
|
|
|
|
T2 EF Cogen |
|
|
|
|
|
|
( |
) |
|
|
— |
|
|
|
( |
) |
|
|
— |
|
|
|
— |
|
|
Agua Blanca |
|
|
— |
|
|
|
|
|
|
|
— |
|
|
|
|
|
|
|
|
|
|
|
|
|
|
Total |
|
$ |
|
|
|
$ |
|
|
|
$ |
( |
) |
|
$ |
|
|
|
$ |
|
|
|
$ |
|
|
|
|
|
|
|
|
|
|
|
|
|
|
|
|
|
|
|
|
|
|
|
|
|
|
|
|
|
|
|
Balance at December 31, 2018 |
|
|
Equity Earnings (Loss) |
|
|
Cash Distributions |
|
|
Disposition |
|
|
Contributions |
|
|
Balance at December 31, 2019 |
|
||||||
|
GCX (3) |
|
$ |
|
|
|
$ |
|
|
|
$ |
( |
) |
|
$ |
— |
|
|
$ |
|
|
|
$ |
|
|
|
Little Missouri 4 |
|
|
|
|
|
|
|
|
|
|
— |
|
|
|
— |
|
|
|
|
|
|
|
|
|
|
T2 Eagle Ford |
|
|
|
|
|
|
( |
) |
|
|
— |
|
|
|
— |
|
|
|
— |
|
|
|
|
|
|
T2 LaSalle |
|
|
|
|
|
|
( |
) |
|
|
— |
|
|
|
— |
|
|
|
— |
|
|
|
|
|
|
GCF |
|
|
|
|
|
|
|
|
|
|
( |
) |
|
|
— |
|
|
|
— |
|
|
|
|
|
|
Cayenne |
|
|
|
|
|
|
|
|
|
|
( |
) |
|
|
— |
|
|
|
|
|
|
|
|
|
|
Agua Blanca |
|
|
|
|
|
|
( |
) |
|
|
( |
) |
|
|
( |
) |
|
|
— |
|
|
|
— |
|
|
Total |
|
$ |
|
|
|
$ |
|
|
|
$ |
( |
) |
|
$ |
( |
) |
|
$ |
|
|
|
$ |
|
|
|
|
|
|
|
|
|
|
|
|
|
|
|
|
|
|
|
|
|
|
|
|
|
|
|
|
|
|
|
Balance at December 31, 2019 |
|
|
Equity Earnings (Loss) |
|
|
Cash Distributions |
|
|
Disposition |
|
|
Contributions |
|
|
Balance at December 31, 2020 |
|
||||||
|
GCX (3) |
|
$ |
|
|
|
$ |
|
|
|
$ |
( |
) |
|
$ |
— |
|
|
$ |
|
|
|
$ |
|
|
|
Little Missouri 4 |
|
|
|
|
|
|
|
|
|
|
( |
) |
|
|
— |
|
|
|
— |
|
|
|
|
|
|
T2 Eagle Ford (4) |
|
|
|
|
|
|
( |
) |
|
|
( |
) |
|
|
— |
|
|
|
— |
|
|
|
|
|
|
T2 LaSalle (4) |
|
|
|
|
|
|
( |
) |
|
|
( |
) |
|
|
— |
|
|
|
— |
|
|
|
|
|
|
GCF (5) |
|
|
|
|
|
|
|
|
|
|
( |
) |
|
|
— |
|
|
|
— |
|
|
|
|
|
|
Cayenne |
|
|
|
|
|
|
|
|
|
|
( |
) |
|
|
— |
|
|
|
— |
|
|
|
|
|
|
Total |
|
$ |
|
|
|
$ |
|
|
|
$ |
( |
) |
|
$ |
— |
|
|
$ |
|
|
|
$ |
|
|
|
(1) |
|
|
(2) |
|
|
(3) |
|
|
(4) |
|
|
(5) |
|
Effective December 31, 2018: (i) we conveyed our
During 2019, we closed on the sale of an equity-method investment for $
F-24
Note 8 — Debt Obligations
|
|
|
December 31, 2020 |
|
|
December 31, 2019 |
|
||
|
Current: |
|
|
|
|
|
|
|
|
|
Accounts receivable securitization facility, due (1) |
|
$ |
|
|
|
$ |
|
|
|
TPL notes, 4¾% fixed rate, due (3) |
|
|
|
|
|
|
— |
|
|
|
|
|
|
|
|
|
|
|
|
Debt issuance costs, net of amortization |
|
|
— |
|
|
|
— |
|
|
Finance lease liabilities |
|
|
|
|
|
|
|
|
|
Current debt obligations |
|
|
|
|
|
|
|
|
|
|
|
|
|
|
|
|
|
|
|
Long-term: |
|
|
|
|
|
|
|
|
|
Senior secured revolving credit facility, variable rate, due (2) |
|
|
|
|
|
|
— |
|
|
Senior unsecured notes: |
|
|
|
|
|
|
|
|
|
5¼% fixed rate, due |
|
|
— |
|
|
|
|
|
|
4¼% fixed rate, due |
|
|
|
|
|
|
|
|
|
6¾% fixed rate, due |
|
|
— |
|
|
|
|
|
|
5⅛% fixed rate, due |
|
|
|
|
|
|
|
|
|
5⅞% fixed rate, due |
|
|
|
|
|
|
|
|
|
5⅜% fixed rate, due |
|
|
|
|
|
|
|
|
|
|
|
|
|
|
|
|
|
|
|
% fixed rate, due |
|
|
|
|
|
|
|
|
|
6⅞% fixed rate, due |
|
|
|
|
|
|
|
|
|
5½% fixed rate, due |
|
|
|
|
|
|
|
|
|
4⅞% fixed rate, due |
|
|
|
|
|
|
— |
|
|
TPL notes, % fixed rate, due (3) |
|
|
— |
|
|
|
|
|
|
TPL notes, 5⅞% fixed rate, due (3) |
|
|
|
|
|
|
|
|
|
Unamortized premium |
|
|
|
|
|
|
|
|
|
|
|
|
|
|
|
|
|
|
|
Debt issuance costs, net of amortization |
|
|
( |
) |
|
|
( |
) |
|
Finance lease liabilities |
|
|
|
|
|
|
|
|
|
Long-term debt |
|
|
|
|
|
|
|
|
|
Total debt obligations |
|
$ |
|
|
|
$ |
|
|
|
Irrevocable standby letters of credit outstanding (2) |
|
$ |
|
|
|
$ |
|
|
________________
|
(1) |
As of December 31, 2020, we had $ |
|
(2) |
As of December 31, 2020, availability under our $ |
|
(3) |
“TPL” refers to Targa Pipeline Partners LP. |
The following table shows the range of interest rates and weighted average interest rate incurred on our variable-rate debt obligations during the year ended December 31, 2020:
|
|
|
Range of Interest Rates Incurred |
|
Weighted Average Interest Rate Incurred |
|
|
TRP Revolver |
|
|
|
|
|
|
Securitization Facility |
|
|
|
|
|
Compliance with Debt Covenants
As of December 31, 2020, we were in compliance with the covenants contained in our various debt agreements.
Debt Obligations
Revolving Credit Facility
The TRP Revolver, which has a maturity date of June 2023, provides available commitments up to $
The TRP Revolver provides for certain changes to occur upon us receiving an investment grade credit rating from Moody’s Investors Service, Inc. (“Moody’s”) or Standard & Poor’s Corporation (“S&P”), including the release of the security interests in all collateral at our request.
The TRP Revolver bears interest, at our option, either at the base rate or the Eurodollar rate. The base rate is equal to the highest of: (i) Bank of America’s prime rate; (ii) the federal funds rate plus
F-25
margin (a) before the collateral release date, ranging from
We are required to pay a commitment fee equal to an applicable rate ranging from (a) before the collateral release date,
The TRP Revolver is collateralized by a pledge of assets and equity from certain of our subsidiaries. Borrowings are guaranteed by our restricted subsidiaries.
The TRP Revolver requires us to maintain a total leverage ratio (the ratio of consolidated indebtedness to our consolidated Adjusted EBITDA, in each case as defined in the TRP Revolver), determined as of the last day of each quarter for the four-fiscal quarter period ending on the date of determination, of no more than (a) before the collateral release date,
The TRP Revolver also requires us to maintain an interest coverage ratio of no less than
The TRP Revolver restricts our ability to make distributions of available cash to unitholders if a default or an event of default (as defined in the TRP Revolver) exists or would result from such distribution. In addition, the TRP Revolver contains various covenants that may limit, among other things, our ability to incur indebtedness, grant liens, make investments, repay or amend the terms of certain other indebtedness, merge or consolidate, sell assets, and engage in transactions with affiliates (in each case, subject to our right to incur indebtedness or grant liens in connection with, and convey accounts receivable as part of, a permitted receivables financing, the aggregate principal of which shall not exceed $
On June 7, 2019, we entered into the First Amendment to the TRP Revolver (the “First Amendment”). The First Amendment, among other things, amended the TRP Revolver to (a) increase the maximum percentage of Consolidated EBITDA attributable to Material Project EBITDA Adjustments from
Accounts Receivable Securitization Facility
In the second quarter of 2020, we amended the Securitization Facility to decrease the facility size from $
F-26
The Securitization Facility provides up to $
Senior Unsecured Notes
All issues of senior unsecured notes are pari passu with existing and future senior indebtedness. They are senior in right of payment to any of our future subordinated indebtedness and are unconditionally guaranteed by us and our restricted subsidiaries. These notes are effectively subordinated to all secured indebtedness under the TRP Revolver and the Securitization Facility, which is secured by accounts receivable pledged under the facility, to the extent of the value of the collateral securing that indebtedness. Interest on all issues of senior unsecured notes is payable semi-annually in arrears.
Our senior unsecured notes and associated indenture agreements restrict our ability to make distributions to unitholders in the event of default (as defined in the indentures). The indentures also restrict our ability and the ability of certain of our subsidiaries to: (i) incur additional debt or enter into sale and leaseback transactions; (ii) pay certain distributions on or repurchase equity interests (only if such distributions do not meet specified conditions); (iii) make certain investments; (iv) incur liens; (v) enter into transactions with affiliates; (vi) merge or consolidate with another company; and (vii) transfer and sell assets. These covenants are subject to a number of important exceptions and qualifications. If at any time when the notes are rated investment grade by either Moody’s or S&P and no Default or Event of Default (each as defined in the indentures) has occurred and is continuing, many of such covenants will terminate and we and our subsidiaries will cease to be subject to such covenants.
We may redeem the senior unsecured notes, in whole or in part, at any time prior to their maturity at a redemption price equal to the principal amount plus an applicable make-whole premium, plus accrued and unpaid interest and liquidation damages, if any, to the redemption date, as specified in the indenture of each series.
We may also redeem up to
We may also redeem all or part of each of the series of senior unsecured notes on or after the redemption dates as specified in the indenture of each series at the redemption prices as specified in the indenture of each series plus accrued and unpaid interest to the redemption date and liquidation damages, if any, on the notes redeemed.
Senior Unsecured Notes Issuances
In April 2018, we issued $
In January 2019, we issued $
In November 2019, we issued $
In August 2020, we issued $
F-27
Subsequent Event
In February 2021, we issued $
Debt Repurchases & Extinguishments
In February 2019, we redeemed in full our outstanding % Senior Notes due 2019 at par value plus accrued interest through the redemption date. The redemption resulted in a non-cash loss to write-off $
During the first half of 2020, we repurchased a portion of its outstanding senior notes on the open market, paying $
Concurrent with the August 2020 Offering, we commenced the August Tender Offer to purchase for cash, subject to certain terms and conditions, any and all of our outstanding % Notes. We accepted for purchase all the notes that were validly tendered as of the early tender date, which totaled $
In November 2020, we redeemed the $559.6 million remaining balance of our Senior Notes due 2023. As a result, we recorded a loss due to debt extinguishment of $
We may retire or purchase various series of our outstanding debt through cash purchases and/or exchanges for other debt, in open market purchases, privately negotiated transactions or otherwise. Such repurchases or exchanges, if any, will depend on prevailing market conditions, our liquidity requirements, contractual restrictions and other factors. The amounts involved may be material.
F-28
Debt Repurchases and Extinguishments Summary
The following table summarizes the impact of debt repurchases and extinguishments that are included in our Consolidated Statements of Operations:
|
|
|
2020 |
|
|
2019 |
|
|
2018 |
|
|||
|
Discount (premium) over face value paid upon redemption: |
|
|
|
|
|
|
|
|
|
|
|
|
|
6¾% Senior Notes due 2024 |
|
$ |
( |
) |
|
$ |
— |
|
|
$ |
— |
|
|
5⅛% Senior Notes due 2025 |
|
|
|
|
|
|
— |
|
|
|
— |
|
|
5⅞% Senior Notes due 2026 |
|
|
|
|
|
|
— |
|
|
|
— |
|
|
5⅜% Senior Notes due 2027 |
|
|
|
|
|
|
— |
|
|
|
— |
|
|
5% Senior Notes due 2028 |
|
|
|
|
|
|
— |
|
|
|
— |
|
|
6½% Senior Notes due 2027 |
|
|
|
|
|
|
— |
|
|
|
— |
|
|
6⅞% Senior Notes due 2029 |
|
|
|
|
|
|
— |
|
|
|
— |
|
|
5½% Senior Notes due 2030 |
|
|
|
|
|
|
— |
|
|
|
— |
|
|
Write-off of debt issuance costs: |
|
|
|
|
|
|
|
|
|
|
|
|
|
TRP Revolver |
|
|
— |
|
|
|
— |
|
|
|
( |
) |
|
5¼% Senior Notes due 2023 |
|
|
( |
) |
|
|
— |
|
|
|
— |
|
|
6¾% Senior Notes due 2024 |
|
|
( |
) |
|
|
|
|
|
|
|
|
|
5⅛% Senior Notes due 2025 |
|
|
( |
) |
|
|
— |
|
|
|
— |
|
|
5⅞% Senior Notes due 2026 |
|
|
( |
) |
|
|
|
|
|
|
|
|
|
5⅜% Senior Notes due 2027 |
|
|
( |
) |
|
|
|
|
|
|
|
|
|
5% Senior Notes due 2028 |
|
|
( |
) |
|
|
— |
|
|
|
— |
|
|
6½% Senior Notes due 2027 |
|
|
( |
) |
|
|
|
|
|
|
|
|
|
6⅞% Senior Notes due 2029 |
|
|
( |
) |
|
|
|
|
|
|
|
|
|
5½% Senior Notes due 2030 |
|
|
( |
) |
|
|
|
|
|
|
|
|
|
4⅛% Senior Notes due 2019 |
|
|
— |
|
|
|
( |
) |
|
|
— |
|
|
Gain (loss) from financing activities |
|
$ |
|
|
|
$ |
( |
) |
|
$ |
( |
) |
The following table shows the contractually scheduled maturities of our debt obligations outstanding at December 31, 2020, for the next five years, and in total thereafter:
|
|
|
Scheduled Maturities of Debt |
|
|||||||||||||||||||||||||
|
|
|
Total |
|
|
2021 |
|
|
2022 |
|
|
2023 |
|
|
2024 |
|
|
2025 |
|
|
After 2025 |
|
|||||||
|
|
|
|
|
|
|
|
|
|
|
|
|
|
|
|
|
|
|
|
|
|
|
|
|
|
|
|
|
|
|
TRP Revolver |
|
$ |
|
|
|
$ |
|
|
|
$ |
|
|
|
$ |
|
|
|
$ |
|
|
|
$ |
|
|
|
$ |
|
|
|
Senior unsecured notes |
|
|
|
|
|
|
|
|
|
|
|
|
|
|
|
|
|
|
|
|
|
|
|
|
|
|
|
|
|
Securitization Facility |
|
|
|
|
|
|
|
|
|
|
|
|
|
|
|
|
|
|
|
|
|
|
|
|
|
|
|
|
|
Total |
|
$ |
|
|
|
$ |
|
|
|
$ |
|
|
|
$ |
|
|
|
$ |
|
|
|
$ |
|
|
|
$ |
|
|
Note 9 — Other Long-term Liabilities
Other long-term liabilities are comprised of the following obligations:
|
|
|
December 31, 2020 |
|
|
December 31, 2019 |
|
||
|
Deferred revenue |
|
$ |
|
|
|
$ |
|
|
|
Asset retirement obligations |
|
|
|
|
|
|
|
|
|
Operating lease liabilities |
|
|
|
|
|
|
|
|
|
Other liabilities |
|
|
|
|
|
|
|
|
|
Total long-term liabilities |
|
$ |
|
|
|
$ |
|
|
Asset Retirement Obligations
Our ARO primarily relate to certain gas gathering pipelines and processing facilities and NGL pipelines.
|
|
|
2020 |
|
|
2019 |
|
||
|
Beginning of period |
|
$ |
|
|
|
$ |
|
|
|
Additions (1) |
|
|
— |
|
|
|
|
|
|
Change in cash flow estimate |
|
|
( |
) |
|
|
( |
) |
|
Accretion expense |
|
|
|
|
|
|
|
|
|
Retirement of ARO |
|
|
|
|
|
|
( |
) |
|
End of period |
|
$ |
|
|
|
$ |
|
|
|
(1) |
|
F-29
Deferred Revenue
Deferred revenue for the years ended December 31, 2020 and 2019, was $
Deferred revenue also includes nonmonetary consideration received in a 2015 amendment (the “gas contract amendment”) to a gas gathering and processing agreement. We measured the estimated fair value of the gathering assets transferred to us using significant other observable inputs representative of a Level 2 fair value measurement. In December 2017, we received monetary consideration to further amend the terms of the gas gathering and processing agreement. The deferred revenue related to these amendments is being recognized on a straight-line basis through the end of the agreement’s term in 2035.
Deferred revenue also includes consideration received for other construction activities of facilities connected to our systems. The deferred revenue related to these other construction activities is being recognized over the periods that future performance will be provided, which extend through 2023.
For the years ended December 31, 2020, 2019 and 2018, we recognized approximately $
The following table shows the components of deferred revenue:
|
|
|
December 31, 2020 |
|
|
December 31, 2019 |
|
||
|
Splitter agreement |
|
$ |
|
|
|
$ |
|
|
|
Gas contract amendment |
|
|
|
|
|
|
|
|
|
Other deferred revenue |
|
|
|
|
|
|
|
|
|
Total deferred revenue |
|
$ |
|
|
|
$ |
|
|
The following table shows the changes in deferred revenue:
|
|
|
2020 |
|
|
2019 |
|
||
|
Balance at beginning of period |
|
$ |
|
|
|
$ |
|
|
|
Additions |
|
|
|
|
|
|
|
|
|
Revenue recognized |
|
|
( |
) |
|
|
( |
) |
|
Balance at end of period |
|
$ |
|
|
|
$ |
|
|
F-30
Note 10 – Leases
We have non-cancellable operating leases primarily associated with our office facilities, rail assets, land, and storage and terminal assets. We have finance leases primarily associated with our tractors and vehicles. Our leases have remaining lease terms of , some of which include options to extend the lease term for up to
The balances of right-of-use assets and liabilities of finance leases and operating leases, and their locations on our Consolidated Balance Sheets are as follows:
|
|
|
|
|
Year Ended December 31, |
|
|||||
|
|
|
Balance Sheet Location |
|
2020 |
|
|
2019 |
|
||
|
Right-of-use assets |
|
|
|
|
|
|
|
|
|
|
|
Operating leases, gross |
|
Other long-term assets |
|
$ |
|
|
|
$ |
|
|
|
Finance leases, gross |
|
Property, plant and equipment |
|
|
|
|
|
|
|
|
|
|
|
|
|
|
|
|
|
|
|
|
|
Lease liabilities |
|
|
|
|
|
|
|
|
|
|
|
Current: |
|
|
|
|
|
|
|
|
|
|
|
Operating leases |
|
Accrued liabilities |
|
$ |
|
|
|
$ |
|
|
|
Finance leases |
|
Current debt obligations |
|
|
|
|
|
|
|
|
|
Non-current: |
|
|
|
|
|
|
|
|
|
|
|
Operating leases |
|
Other long-term liabilities |
|
$ |
|
|
|
$ |
|
|
|
Finance leases |
|
Long-term debt |
|
|
|
|
|
|
|
|
Operating lease costs and short-term lease costs are included in Operating expenses or General and administrative expense in our Consolidated Statements of Operations, depending on the nature of the leases. Finance lease costs are included in Depreciation and amortization expense and Interest income (expense) in our Consolidated Statements of Operations. The components of lease expense were as follows:
|
|
|
|
|
Year Ended December 31, |
|
|||||
|
|
|
|
|
2020 |
|
|
2019 |
|
||
|
Lease cost |
|
|
|
|
|
|
|
|
|
|
|
Operating lease cost |
|
|
|
$ |
|
|
|
$ |
|
|
|
Short-term lease cost |
|
|
|
|
|
|
|
|
|
|
|
Variable lease cost |
|
|
|
|
|
|
|
|
|
|
|
Finance lease cost |
|
|
|
|
|
|
|
|
|
|
|
Amortization of right-of-use assets |
|
|
|
|
|
|
|
|
|
|
|
Interest expense |
|
|
|
|
|
|
|
|
|
|
|
Total lease cost |
|
|
|
$ |
|
|
|
$ |
|
|
During the year ended December 31, 2018, total operating leases expense incurred was $
Other supplemental information related to our leases are as follows:
|
|
|
Year Ended December 31, |
|
|||||
|
|
|
2020 |
|
|
2019 |
|
||
|
Cash paid for amounts included in the measurement of lease liabilities: |
|
|
|
|
|
|
|
|
|
Operating cash flows for operating leases |
|
$ |
|
|
|
$ |
|
|
|
Operating cash flows for finance leases |
|
|
|
|
|
|
|
|
|
Financing cash flows for finance leases |
|
|
|
|
|
|
|
|
F-31
The weighted-average remaining lease terms for both operating leases and finance leases is
The following table presents the maturities of our lease liabilities under non-cancellable leases as of December 31, 2020:
|
|
|
Operating Leases |
|
|
Finance Leases |
|
||
|
Future Minimum Lease Payments Beginning After December 31, |
|
|
|
|
|
|
|
|
|
2020 |
|
$ |
|
|
|
$ |
|
|
|
2021 |
|
|
|
|
|
|
|
|
|
2022 |
|
|
|
|
|
|
|
|
|
2023 |
|
|
|
|
|
|
|
|
|
2024 |
|
|
|
|
|
|
|
|
|
Thereafter |
|
|
— |
|
|
|
— |
|
|
Total undiscounted cash flows |
|
|
|
|
|
|
|
|
|
Less imputed interest |
|
|
( |
) |
|
|
( |
) |
|
Total lease liabilities |
|
$ |
|
|
|
$ |
|
|
Note 11 — Partnership Units and Related Matters
Distributions
TRC is entitled to receive all available Partnership distributions after payment of any preferred unit distributions.
The following details the distributions declared or paid by us during 2020, 2019 and 2018:
|
Three Months Ended |
|
Date Paid or To Be Paid |
|
Total Distributions |
|
|
Distributions to Targa Resources Corp. |
|
||
|
(In millions, except per share amounts) |
|
|||||||||
|
2020 |
|
|
|
|
|
|
|
|
|
|
|
December 31, 2020 |
|
|
|
$ |
|
|
|
$ |
|
|
|
September 30, 2020 |
|
|
|
|
|
|
|
|
|
|
|
June 30, 2020 |
|
|
|
|
|
|
|
|
|
|
|
March 31, 2020 |
|
|
|
|
|
|
|
|
|
|
|
2019 |
|
|
|
|
|
|
|
|
|
|
|
December 31, 2019 |
|
|
|
$ |
|
|
|
$ |
|
|
|
September 30, 2019 |
|
|
|
|
|
|
|
|
|
|
|
June 30, 2019 |
|
|
|
|
|
|
|
|
|
|
|
March 31, 2019 |
|
|
|
|
|
|
|
|
|
|
|
2018 |
|
|
|
|
|
|
|
|
|
|
|
December 31, 2018 |
|
|
|
$ |
|
|
|
$ |
|
|
|
September 30, 2018 |
|
|
|
|
|
|
|
|
|
|
|
June 30, 2018 |
|
|
|
|
|
|
|
|
|
|
|
March 31, 2018 |
|
|
|
|
|
|
|
|
|
|
Contributions
All capital contributions are allocated
Preferred Units
In
We paid total distributions of $
F-32
Note 12 — Derivative Instruments and Hedging Activities
The primary purpose of our commodity risk management activities is to manage our exposure to commodity price risk and reduce volatility in our operating cash flow due to fluctuations in commodity prices. We have entered into derivative instruments to hedge the commodity price risks associated with a portion of our expected (i) natural gas, NGL, and condensate equity volumes in our Gathering and Processing operations that result from percent-of-proceeds processing arrangements, (ii) future commodity purchases and sales in our Logistics and Transportation segment and (iii) natural gas transportation basis risk in our Logistics and Transportation segment. The hedge positions associated with (i) and (ii) above will move favorably in periods of falling commodity prices and unfavorably in periods of rising commodity prices and are primarily designated as cash flow hedges for accounting purposes.
The hedges generally match the NGL product composition and the NGL delivery points of our physical equity volumes. Our natural gas hedges are a mixture of specific gas delivery points and Henry Hub. The NGL hedges may be transacted as specific NGL hedges or as baskets of ethane, propane, normal butane, isobutane and natural gasoline based upon our expected equity NGL composition. We believe this approach avoids uncorrelated risks resulting from employing hedges on crude oil or other petroleum products as “proxy” hedges of NGL prices. Our natural gas and NGL hedges are settled using published index prices for delivery at various locations.
We hedge a portion of our condensate equity volumes using crude oil hedges that are based on the NYMEX futures contracts for West Texas Intermediate light, sweet crude, which approximates the prices received for condensate. This exposes us to a market differential risk if the NYMEX futures do not move in exact parity with the sales price of our underlying condensate equity volumes.
We also enter into derivative instruments to help manage other short-term commodity-related business risks and take advantage of market opportunities. We have not designated these derivatives as hedges and record changes in fair value and cash settlements to revenues as current income.
At December 31, 2020, the notional volumes of our commodity derivative contracts were:
|
Commodity |
Instrument |
Unit |
2021 |
|
2022 |
|
2023 |
|
2024 |
|
2025 |
|
|||||
|
Natural Gas |
Swaps |
MMBtu/d |
|
|
|
|
|
|
|
|
|
|
|
|
|
|
|
|
Natural Gas |
Basis Swaps |
MMBtu/d |
|
|
|
|
|
|
|
|
|
|
|
|
|
|
|
|
NGL |
Swaps |
Bbl/d |
|
|
|
|
|
|
|
|
|
|
|
|
|
|
|
|
NGL |
Futures |
Bbl/d |
|
|
|
|
|
|
|
|
|
|
|
|
|
|
|
|
Condensate |
Swaps |
Bbl/d |
|
|
|
|
|
|
|
|
|
|
|
|
|
|
|
Our derivative contracts are subject to netting arrangements that permit our contracting subsidiaries to net cash settle offsetting asset and liability positions with the same counterparty within the same Targa entity. We record derivative assets and liabilities on our Consolidated Balance Sheets on a gross basis, without considering the effect of master netting arrangements.
|
|
|
|
|
Fair Value as of December 31, 2020 |
|
|
Fair Value as of December 31, 2019 |
|
||||||||||
|
|
|
Balance Sheet |
|
Derivative |
|
|
Derivative |
|
|
Derivative |
|
|
Derivative |
|
||||
|
|
|
Location |
|
Assets |
|
|
Liabilities |
|
|
Assets |
|
|
Liabilities |
|
||||
|
Derivatives designated as hedging instruments |
|
|
|
|
|
|
|
|
|
|
|
|
|
|
|
|
|
|
|
Commodity contracts |
|
Current |
|
$ |
|
|
|
$ |
|
|
|
$ |
|
|
|
$ |
|
|
|
|
|
Long-term |
|
|
|
|
|
|
|
|
|
|
|
|
|
|
|
|
|
Total derivatives designated as hedging instruments |
|
|
|
$ |
|
|
|
$ |
|
|
|
$ |
|
|
|
$ |
|
|
|
Derivatives not designated as hedging instruments |
|
|
|
|
|
|
|
|
|
|
|
|
|
|
|
|
|
|
|
Commodity contracts |
|
Current |
|
$ |
|
|
|
$ |
|
|
|
$ |
|
|
|
$ |
|
|
|
|
|
Long-term |
|
|
|
|
|
|
|
|
|
|
|
|
|
|
|
|
|
Total derivatives not designated as hedging instruments |
|
|
|
$ |
|
|
|
$ |
|
|
|
$ |
|
|
|
$ |
|
|
|
Total current position |
|
|
|
$ |
|
|
|
$ |
|
|
|
$ |
|
|
|
$ |
|
|
|
Total long-term position |
|
|
|
|
|
|
|
|
|
|
|
|
|
|
|
|
|
|
|
Total derivatives |
|
|
|
$ |
|
|
|
$ |
|
|
|
$ |
|
|
|
$ |
|
|
F-33
The pro forma impact of reporting derivatives on our Consolidated Balance Sheets on a net basis is as follows:
|
|
|
|
Gross Presentation |
|
|
Pro Forma Net Presentation |
|
||||||||||||||
|
December 31, 2020 |
|
Asset |
|
|
Liability |
|
|
Collateral |
|
|
Asset |
|
|
Liability |
|
||||||
|
Current Position |
|
|
|
|
|
|
|
|
|
|
|
|
|
|
|
|
|
|
|
|
|
|
|
Counterparties with offsetting positions or collateral |
|
$ |
|
|
|
$ |
( |
) |
|
$ |
|
|
|
$ |
|
|
|
$ |
( |
) |
|
|
Counterparties without offsetting positions - assets |
|
|
|
|
|
|
- |
|
|
|
- |
|
|
|
|
|
|
|
- |
|
|
|
Counterparties without offsetting positions - liabilities |
|
|
- |
|
|
|
( |
) |
|
|
- |
|
|
|
- |
|
|
|
( |
) |
|
|
|
|
|
|
|
|
|
( |
) |
|
|
|
|
|
|
|
|
|
|
( |
) |
|
Long Term Position |
|
|
|
|
|
|
|
|
|
|
|
|
|
|
|
|
|
|
|
|
|
|
|
Counterparties with offsetting positions or collateral |
|
|
|
|
|
|
( |
) |
|
|
- |
|
|
|
|
|
|
|
( |
) |
|
|
Counterparties without offsetting positions - assets |
|
|
|
|
|
|
- |
|
|
|
- |
|
|
|
|
|
|
|
- |
|
|
|
Counterparties without offsetting positions - liabilities |
|
|
- |
|
|
|
( |
) |
|
|
- |
|
|
|
- |
|
|
|
( |
) |
|
|
|
|
|
|
|
|
|
( |
) |
|
|
- |
|
|
|
|
|
|
|
( |
) |
|
Total Derivatives |
|
|
|
|
|
|
|
|
|
|
|
|
|
|
|
|
|
|
|
|
|
|
|
Counterparties with offsetting positions or collateral |
|
|
|
|
|
|
( |
) |
|
|
|
|
|
|
|
|
|
|
( |
) |
|
|
Counterparties without offsetting positions - assets |
|
|
|
|
|
|
- |
|
|
|
- |
|
|
|
|
|
|
|
- |
|
|
|
Counterparties without offsetting positions - liabilities |
|
|
- |
|
|
|
( |
) |
|
|
- |
|
|
|
- |
|
|
|
( |
) |
|
|
|
|
$ |
|
|
|
$ |
( |
) |
|
$ |
|
|
|
$ |
|
|
|
$ |
( |
) |
|
|
|
|
|
|
|
|
|
|
|
|
|
|
|
|
|
|
|
|
|
|
|
|
|
|
|
Gross Presentation |
|
|
Pro Forma Net Presentation |
|
||||||||||||||
|
December 31, 2019 |
|
Asset |
|
|
Liability |
|
|
Collateral |
|
|
Asset |
|
|
Liability |
|
||||||
|
Current Position |
|
|
|
|
|
|
|
|
|
|
|
|
|
|
|
|
|
|
|
|
|
|
|
Counterparties with offsetting positions or collateral |
|
$ |
|
|
|
$ |
( |
) |
|
$ |
( |
) |
|
$ |
|
|
|
$ |
( |
) |
|
|
Counterparties without offsetting positions - assets |
|
|
|
|
|
|
- |
|
|
|
- |
|
|
|
|
|
|
|
- |
|
|
|
Counterparties without offsetting positions - liabilities |
|
|
- |
|
|
|
( |
) |
|
|
- |
|
|
|
- |
|
|
|
( |
) |
|
|
|
|
|
|
|
|
|
( |
) |
|
|
( |
) |
|
|
|
|
|
|
( |
) |
|
Long Term Position |
|
|
|
|
|
|
|
|
|
|
|
|
|
|
|
|
|
|
|
|
|
|
|
Counterparties with offsetting positions or collateral |
|
|
|
|
|
|
( |
) |
|
|
- |
|
|
|
|
|
|
|
( |
) |
|
|
Counterparties without offsetting positions - assets |
|
|
|
|
|
|
- |
|
|
|
- |
|
|
|
|
|
|
|
- |
|
|
|
Counterparties without offsetting positions - liabilities |
|
|
- |
|
|
|
( |
) |
|
|
- |
|
|
|
- |
|
|
|
( |
) |
|
|
|
|
|
|
|
|
|
( |
) |
|
|
- |
|
|
|
|
|
|
|
( |
) |
|
Total Derivatives |
|
|
|
|
|
|
|
|
|
|
|
|
|
|
|
|
|
|
|
|
|
|
|
Counterparties with offsetting positions or collateral |
|
|
|
|
|
|
( |
) |
|
|
( |
) |
|
|
|
|
|
|
( |
) |
|
|
Counterparties without offsetting positions - assets |
|
|
|
|
|
|
- |
|
|
|
- |
|
|
|
|
|
|
|
- |
|
|
|
Counterparties without offsetting positions - liabilities |
|
|
- |
|
|
|
( |
) |
|
|
- |
|
|
|
- |
|
|
|
( |
) |
|
|
|
|
$ |
|
|
|
$ |
( |
) |
|
$ |
( |
) |
|
$ |
|
|
|
$ |
( |
) |
Our payment obligations in connection with a majority of these hedging transactions are secured by a first priority lien in the collateral securing the TRP Revolver that ranks equal in right of payment with liens granted in favor of our senior secured lenders. Some of our hedges are futures contracts executed through brokers that clear the hedges through an exchange. We maintain a margin deposit with the brokers in an amount sufficient enough to cover the fair value of our open futures positions. The margin deposit is considered collateral, which is located within Other current assets on our Consolidated Balance Sheets and is not offset against the fair value of our derivative instruments.
The fair value of our derivative instruments, depending on the type of instrument, was determined by the use of present value methods or standard option valuation models with assumptions about commodity prices based on those observed in underlying markets. The estimated fair value of our derivative instruments was a net liability of $
The following tables reflect amounts recorded in Other comprehensive income (“OCI”) and amounts reclassified from OCI to revenue for the periods indicated:
|
Derivatives in Cash Flow |
|
Gain (Loss) Recognized in OCI on Derivatives (Effective Portion) |
|
|||||||||
|
Hedging Relationships |
|
2020 |
|
|
2019 |
|
|
2018 |
|
|||
|
Commodity contracts |
|
$ |
( |
) |
|
$ |
|
|
|
$ |
|
|
|
|
|
|
|
|
|
|
|
|
|
|
|
|
|
|
|
Gain (Loss) Reclassified from OCI into Income (Effective Portion) |
|
|||||||||
|
Location of Gain (Loss) |
|
2020 |
|
|
2019 |
|
|
2018 |
|
|||
|
Revenues |
|
$ |
|
|
|
$ |
|
|
|
$ |
( |
) |
F-34
Based on valuations as of December 31, 2020, we expect to reclassify commodity hedge related deferred losses of ($
Our consolidated earnings are also affected by the use of the mark-to-market method of accounting for derivative instruments that do not qualify for hedge accounting or that have not been designated as hedges. The changes in fair value of these instruments are recorded on the balance sheet and through earnings rather than being deferred until the anticipated transaction settles.
|
Derivatives Not Designated |
|
Location of Gain Recognized in |
|
Gain (Loss) Recognized in Income on Derivatives |
|
|||||||||
|
as Hedging Instruments |
|
Income on Derivatives |
|
2020 |
|
|
2019 |
|
|
2018 |
|
|||
|
Commodity contracts |
|
Revenue |
|
$ |
|
|
|
$ |
( |
) |
|
$ |
( |
) |
See Note 13 – Fair Value Measurements and Note 23 – Segment Information for additional disclosures related to derivative instruments and hedging activities.
Note 13 — Fair Value Measurements
Under GAAP, our Consolidated Balance Sheets reflect a mixture of measurement methods for financial assets and liabilities (“financial instruments”). Derivative financial instruments and contingent consideration related to business acquisitions are reported at fair value on our Consolidated Balance Sheets. Other financial instruments are reported at historical cost or amortized cost on our Consolidated Balance Sheets. The following are additional qualitative and quantitative disclosures regarding fair value measurements of financial instruments.
Fair Value of Derivative Financial Instruments
Our derivative instruments consist of financially settled commodity swaps, futures, option contracts and fixed-price forward commodity contracts with certain counterparties. We determine the fair value of our derivative contracts using present value methods or standard option valuation models with assumptions about commodity prices based on those observed in underlying markets. We have consistently applied these valuation techniques in all periods presented and we believe we have obtained the most accurate information available for the types of derivative contracts we hold.
The fair values of our derivative instruments are sensitive to changes in forward pricing on natural gas, NGLs and crude oil. The financial position of these derivatives at December 31, 2020, a net liability position of $
Fair Value of Other Financial Instruments
Due to their cash or near-cash nature, the carrying value of other financial instruments included in working capital (i.e., cash and cash equivalents, accounts receivable, accounts payable) approximates their fair value. Long-term debt is primarily the other financial instrument for which carrying value could vary significantly from fair value. We determined the supplemental fair value disclosures for our long-term debt as follows:
|
|
• |
The TRP Revolver and the Securitization Facility are based on carrying value, which approximates fair value as their interest rates are based on prevailing market rates; and |
|
|
• |
Senior unsecured notes are based on quoted market prices derived from trades of the debt. |
Contingent consideration liabilities related to business acquisitions are carried at fair value until the end of the related earn-out period.
F-35
Fair Value Hierarchy
We categorize the inputs to the fair value measurements of financial assets and liabilities at each balance sheet reporting date using a three-tier fair value hierarchy that prioritizes the significant inputs used in measuring fair value:
|
|
• |
Level 1 – observable inputs such as quoted prices in active markets; |
|
|
• |
Level 2 – inputs other than quoted prices in active markets that we can directly or indirectly observe to the extent that the markets are liquid for the relevant settlement periods; and |
|
|
• |
Level 3 – unobservable inputs in which little or no market data exists, therefore we must develop our own assumptions. |
The following table shows a breakdown by fair value hierarchy category for (1) financial instruments measurements included on our Consolidated Balance Sheets at fair value and (2) supplemental fair value disclosures for other financial instruments:
|
|
|
December 31, 2020 |
|
|||||||||||||||||
|
|
|
|
|
|
|
Fair Value |
|
|||||||||||||
|
|
|
Carrying Value |
|
|
Total |
|
|
Level 1 |
|
|
Level 2 |
|
|
Level 3 |
|
|||||
|
Financial Instruments Recorded on Our Consolidated Balance Sheets at Fair Value: |
|
|
|
|
|
|
|
|
|
|
|
|
|
|
|
|
|
|
|
|
|
Assets from commodity derivative contracts (1) |
|
$ |
|
|
|
$ |
|
|
|
$ |
— |
|
|
$ |
|
|
|
$ |
— |
|
|
Liabilities from commodity derivative contracts (1) |
|
|
|
|
|
|
|
|
|
|
— |
|
|
|
|
|
|
|
|
|
|
TPL contingent consideration (2) |
|
|
|
|
|
|
|
|
|
|
— |
|
|
|
— |
|
|
|
|
|
|
Financial Instruments Recorded on Our Consolidated Balance Sheets at Carrying Value: |
|
|
|
|
|
|
|
|
|
|
|
|
|
|
|
|
|
|
|
|
|
Cash and cash equivalents |
|
|
|
|
|
|
|
|
|
|
— |
|
|
|
— |
|
|
|
— |
|
|
TRP Revolver |
|
|
|
|
|
|
|
|
|
|
— |
|
|
|
|
|
|
|
— |
|
|
Senior unsecured notes |
|
|
|
|
|
|
|
|
|
|
— |
|
|
|
|
|
|
|
— |
|
|
Securitization Facility |
|
|
|
|
|
|
|
|
|
|
— |
|
|
|
|
|
|
|
— |
|
|
|
|
|
|
|
|
|
|
|
|
|
|
|
|
|
|
|
|
|
|
|
|
|
December 31, 2019 |
|
||||||||||||||||||
|
|
|
|
|
|
Fair Value |
|
||||||||||||||
|
|
|
Carrying Value |
|
Total |
|
Level 1 |
|
Level 2 |
|
Level 3 |
|
|||||||||
|
Financial Instruments Recorded on Our Consolidated Balance Sheets at Fair Value: |
|
|
|
|
|
|
|
|
|
|
|
|
|
|
|
|
|
|
|
|
|
Assets from commodity derivative contracts (1) |
|
$ |
|
|
|
$ |
|
|
|
$ |
— |
|
|
$ |
|
|
|
$ |
|
|
|
Liabilities from commodity derivative contracts (1) |
|
|
|
|
|
|
|
|
|
|
— |
|
|
|
|
|
|
|
|
|
|
TPL contingent consideration (2) |
|
|
|
|
|
|
|
|
|
|
— |
|
|
|
— |
|
|
|
|
|
|
Financial Instruments Recorded on Our Consolidated Balance Sheets at Carrying Value: |
|
|
|
|
|
|
|
|
|
|
|
|
|
|
|
|
|
|
|
|
|
Cash and cash equivalents |
|
|
|
|
|
|
|
|
|
|
— |
|
|
|
— |
|
|
|
— |
|
|
TRP Revolver |
|
|
— |
|
|
|
— |
|
|
|
— |
|
|
|
— |
|
|
|
— |
|
|
Senior unsecured notes |
|
|
|
|
|
|
|
|
|
|
— |
|
|
|
|
|
|
|
— |
|
|
Securitization Facility |
|
|
|
|
|
|
|
|
|
|
— |
|
|
|
|
|
|
|
— |
|
|
(1) |
|
|
(2) |
|
Additional Information Regarding Level 3 Fair Value Measurements Included on Our Consolidated Balance Sheets
We reported certain of our swaps and option contracts at fair value using Level 3 inputs due to such derivatives not having observable market prices or implied volatilities for substantially the full term of the derivative asset or liability. For valuations that include both observable and unobservable inputs, if the unobservable input is determined to be significant to the overall inputs, the entire valuation is categorized in Level 3. This includes derivatives valued using indicative price quotations whose contract length extends into unobservable periods.
The fair value of these swaps is determined using a discounted cash flow valuation technique based on a forward commodity basis curve. For these derivatives, the primary input to the valuation model is the forward commodity basis curve, which is based on observable or public data sources and extrapolated when observable prices are not available.
F-36
The significant unobservable inputs used in the fair value measurements of our Level 3 derivatives were (i) the forward natural gas liquids pricing curves, for which a significant portion of the derivative’s term is beyond available forward pricing and (ii) implied volatilities, which are unobservable as a result of inactive natural gas liquids options trading. The change in the fair value of Level 3 derivatives associated with a 10% change in the forward basis curve where prices are not observable was immaterial. As of December 31, 2020, we had
The fair value of the TPL contingent consideration was determined using a probability-based model measuring the likelihood of meeting certain volumetric measures. The inputs are not observable; therefore, the entire valuation of the contingent consideration is categorized in Level 3.
The following table summarizes the changes in fair value of our financial instruments classified as Level 3 in the fair value hierarchy:
|
|
|
|
Commodity |
|
|
|
|
|
|
|
|
|
|
Derivative Contracts |
|
|
Contingent |
|
||
|
|
|
|
Asset/(Liability) |
|
|
Consideration |
|
||
|
Balance, December 31, 2019 |
|
$ |
( |
) |
|
$ |
( |
) |
|
|
Change in fair value of TPL contingent consideration |
|
|
— |
|
|
|
|
|
|
|
New Level 3 derivative instruments |
|
|
( |
) |
|
|
— |
|
|
|
Transfers out of Level 3 (1) |
|
|
|
|
|
|
— |
|
|
|
Balance, December 31, 2020 |
|
$ |
( |
) |
|
$ |
( |
) |
|
|
(1) |
|
Assets and Liabilities Measured at Fair Value on a Nonrecurring Basis
Nonfinancial assets and liabilities, such as long-lived assets, are measured at fair value on a nonrecurring basis upon impairment. During the year ended December 31, 2020, we recorded non-cash pre-tax impairments of $
The techniques described above may produce a fair value calculation that may not be indicative or reflective of future fair values. Furthermore, while we believe our valuation techniques are appropriate and consistent with other market participants, the use of different techniques or assumptions to determine fair value of certain financial and nonfinancial assets and liabilities could result in a different fair value measurement at the reporting date.
F-37
Note 14 — Related Party Transactions
Transactions with Unconsolidated Affiliates
The following table summarizes transactions with unconsolidated affiliates:
|
|
|
GCF |
|
|
T2 Joint Ventures |
|
|
Cayenne |
|
|
GCX |
|
|
Little Missouri 4 |
|
|
Agua Blanca |
|
|
Total |
|
|||||||
|
2020: |
|
|
|
|
|
|
|
|
|
|
|
|
|
|
|
|
|
|
|
|
|
|
|
|
|
|
|
|
|
Revenues |
|
$ |
|
|
|
$ |
|
|
|
$ |
— |
|
|
$ |
|
|
|
$ |
|
|
|
$ |
— |
|
|
$ |
|
|
|
Product purchases |
|
|
— |
|
|
|
— |
|
|
|
( |
) |
|
|
( |
) |
|
|
— |
|
|
|
— |
|
|
|
( |
) |
|
Operating expenses |
|
|
( |
) |
|
|
( |
) |
|
|
( |
) |
|
|
— |
|
|
|
( |
) |
|
|
— |
|
|
|
( |
) |
|
General and administrative expenses |
|
|
— |
|
|
|
— |
|
|
|
— |
|
|
|
— |
|
|
|
( |
) |
|
|
— |
|
|
|
( |
) |
|
2019: |
|
|
|
|
|
|
|
|
|
|
|
|
|
|
|
|
|
|
|
|
|
|
|
|
|
|
|
|
|
Revenues |
|
$ |
|
|
|
$ |
|
|
|
$ |
— |
|
|
$ |
|
|
|
$ |
|
|
|
$ |
— |
|
|
$ |
|
|
|
Product purchases |
|
|
( |
) |
|
|
— |
|
|
|
( |
) |
|
|
( |
) |
|
|
— |
|
|
|
— |
|
|
|
( |
) |
|
Operating expenses |
|
|
— |
|
|
|
( |
) |
|
|
( |
) |
|
|
— |
|
|
|
— |
|
|
|
( |
) |
|
|
( |
) |
|
General and administrative expenses |
|
|
— |
|
|
|
— |
|
|
|
— |
|
|
|
— |
|
|
|
( |
) |
|
|
— |
|
|
|
( |
) |
|
2018: |
|
|
|
|
|
|
|
|
|
|
|
|
|
|
|
|
|
|
|
|
|
|
|
|
|
|
|
|
|
Revenues |
|
$ |
|
|
|
$ |
|
|
|
$ |
— |
|
|
$ |
|
|
|
$ |
— |
|
|
$ |
— |
|
|
$ |
|
|
|
Product purchases |
|
|
( |
) |
|
|
( |
) |
|
|
( |
) |
|
|
( |
) |
|
|
— |
|
|
|
— |
|
|
|
( |
) |
|
Operating expenses |
|
|
— |
|
|
|
( |
) |
|
|
— |
|
|
|
— |
|
|
|
— |
|
|
|
— |
|
|
|
( |
) |
Relationship with Targa
We do not have any employees. Targa provides operational, general and administrative and other services to us associated with our existing assets and assets acquired from third parties. Targa performs centralized corporate functions for us, such as legal, accounting, treasury, insurance, risk management, health, safety and environmental, information technology, human resources, credit, payroll, internal audit, taxes, engineering and marketing.
Our Partnership Agreement governs the reimbursement of costs incurred by Targa on behalf of us. Targa charges us for all the direct costs of the employees assigned to our operations, as well as all general and administrative support costs other than costs attributable to Targa’s status as a separate reporting company. We generally reimburse Targa monthly for cost allocations to the extent that Targa has made a cash outlay.
The following table summarizes transactions with Targa:
|
|
Year Ended December 31, |
|
||||||||
|
|
2020 |
|
|
2019 |
|
2018 |
|
|||
|
Targa billings of payroll and related costs included in operating expenses |
$ |
|
|
|
$ |
|
|
$ |
|
|
|
Targa allocation of general and administrative expense |
|
|
|
|
|
|
|
|
|
|
|
Cash distributions to Targa based on general partner and limited partner ownership |
|
|
|
|
|
|
|
|
|
|
|
Cash contributions from Targa related to limited partner ownership (1) |
|
|
|
|
|
|
|
|
|
|
|
Cash contributions from Targa to maintain its |
|
|
|
|
|
|
|
|
|
|
________________
|
(1) |
|
Relationship with Sajet Resources LLC
In December 2010, immediately prior to Targa’s initial public offering, Sajet Resources LLC (“Sajet”) was spun-off from Targa. At the time, Rene Joyce, James Whalen and Joe Bob Perkins, directors of Targa, were also directors of Sajet. Joe Bob Perkins, James Whalen, Michael Heim, Jeffrey McParland, Paul Chung, and Matthew Meloy, executive officers of Targa at the time, were also executive officers of Sajet. The current directors of Sajet are Matthew Meloy, Jennifer Kneale, Regina Gregory and Scott Rogan. The current executive officers of Sajet are Matthew Meloy, Robert Muraro, Jennifer Kneale, Regina Gregory and Julie Boushka. The primary assets of Sajet are real property. Sajet also holds (i) an ownership interest in Floridian Natural Gas Storage Company, LLC through a December 2016 merger with Tesla Resources LLC and (ii) an ownership interest in Allied CNG Ventures LLC. Former holders of our pre-IPO common equity, including certain of our current and former executives, managers and directors collectively own an
F-38
In March 2018, we acquired the
We hold
Note 15 — Commitments
Future non-cancelable commitments related to certain contractual obligations are presented below for each of the next five fiscal years and in aggregate thereafter:
|
|
In Aggregate |
|
|
2021 |
|
|
2022 |
|
|
2023 |
|
|
2024 |
|
|
2025 |
|
|
Thereafter |
|
|||||||
|
Land sites and rights of way (1) |
$ |
|
|
|
$ |
|
|
|
$ |
|
|
|
$ |
|
|
|
$ |
|
|
|
$ |
|
|
|
$ |
|
|
|
(1) |
|
Total expenses incurred under the above non-cancelable commitments were:
|
|
2020 |
|
|
2019 |
|
|
2018 |
|
|||
|
Land sites and rights of way |
$ |
|
|
|
$ |
|
|
|
$ |
|
|
Note 16 – Contingencies
Legal Proceedings
We are a party to various legal, administrative and regulatory proceedings that have arisen in the ordinary course of our business. We are also a party to various proceedings with governmental environmental agencies, including, but not limited to the U.S. Environmental Protection Agency, Texas Commission on Environmental Quality, Oklahoma Department of Environmental Quality, New Mexico Environment Department, Louisiana Department of Environmental Quality and North Dakota Department of Environmental Quality, which assert monetary sanctions for alleged violations of environmental regulations, including air emissions, discharges into the environment and reporting deficiencies, related to events that have arisen at certain of our facilities in the ordinary course of our business.
Note 17 — Significant Risks and Uncertainties
Nature of Our Operations in Midstream Energy Industry
We operate in the midstream energy industry. Our business activities include gathering, processing, transporting, fractionating, storing, purchasing and selling natural gas, NGLs and crude oil. Our results of operations, cash flows and financial condition may be affected by changes in the commodity prices of these hydrocarbon products and changes in the relative price levels among these hydrocarbon products. In general, the prices of natural gas, NGLs, condensate and other hydrocarbon products are subject to fluctuations in response to changes in supply, market uncertainty and a variety of additional factors that are beyond our control, including pandemics (like COVID-19) and other public health crises.
Our profitability could be impacted by a decline in the volume of crude oil, natural gas, NGLs and condensate transported, gathered or processed at our facilities. A material decrease in natural gas or condensate production or condensate refining, as a result of depressed commodity prices, a decrease in exploration and development activities, or otherwise, could result in a decline in the volume of crude oil, natural gas, NGLs and condensate handled by our facilities.
A reduction in demand for NGL products by the petrochemical, refinery or heating industries, whether because of (i) general economic conditions, (ii) reduced demand by consumers for the end products made with NGL products, (iii) increased competition from petroleum-based products due to the pricing differences, (iv) adverse weather conditions, (v) government regulations affecting commodity prices and production levels of hydrocarbons or the content of motor gasoline or (vi) other reasons, could also adversely affect our results of operations, cash flows and financial position.
F-39
Our principal market risks are exposure to changes in commodity prices, particularly to the prices of natural gas, NGLs and crude oil, and changes in interest rates.
Commodity Price Risk
A portion of our revenues are derived from percent-of-proceeds contracts under which we receive a portion of the proceeds from the sale of commodities as payment for services. The prices of natural gas, NGLs and crude oil are subject to fluctuations in response to changes in supply, demand, market uncertainty and a variety of additional factors beyond our control. In response to these price risks, we monitor NGL inventory levels in order to mitigate losses related to downward price exposure.
Additionally, in an effort to reduce the variability of our cash flows, we have entered into derivative financial instruments to hedge the commodity price associated with a significant portion of our expected natural gas, NGL and condensate equity volumes, future commodity purchases and sales, and transportation basis risk. Historically, these transactions have included both swaps and purchased puts (or floors) and calls (or caps) to hedge additional expected equity commodity volumes without creating volumetric risk. We hedge a higher percentage of our expected equity volumes in the earlier future periods. We also enter into commodity financial instruments in conjunction with marketing opportunities available to us in the operations of our logistics and transportation assets. With swaps, we typically receive an agreed upon fixed price for a specified notional quantity and pay the hedge counterparty a floating price for that same quantity based upon published index prices. Since we receive from our customers substantially the same floating index price from the sale of the underlying physical commodity, these transactions are designed to effectively lock-in the agreed fixed price in advance for the volumes hedged. In order to avoid having a greater volume hedged than actual equity volumes, we limit our use of swaps to hedge the prices of less than our expected equity volumes. Our commodity hedges may expose us to the risk of financial loss in certain circumstances.
We also enter into commodity price hedging transactions using futures contracts on futures exchanges. Exchange traded futures are subject to exchange margin requirements, so we may have to increase our cash deposit due to a rise in natural gas, NGL and crude oil prices.
COVID-19 and Current Market Conditions
During 2020, as the COVID-19 pandemic spread and travel and other restrictions were implemented globally, the prices of and demand for commodities declined substantially, and commodity prices remain weak relative to historical levels and continue to remain volatile. While uncertainties associated with the impacts of COVID-19 continue, energy demand and commodity prices have begun to recover compared to the first half of 2020. The pace and scope of recovery is uncertain at this time and may extend beyond 2021, and our business could be adversely affected. As there is significant uncertainty around the breadth and duration of the disruptions to global energy markets related to the pandemic, we are unable to determine the extent that these events could materially impact our future financial position, operations and/or cash flows.
Counterparty Risk – Credit and Concentration
Derivative Counterparty Risk
Where we are exposed to credit risk in our financial instrument transactions, management analyzes the counterparty’s financial condition prior to entering into an agreement, establishes credit and/or margin limits and monitors the appropriateness of these limits on an ongoing basis. Generally, management does not require collateral and does not anticipate nonperformance by our counterparties.
We have master netting provisions in the International Swap Dealers Association agreements with our derivative counterparties. These netting provisions allow us to net settle asset and liability positions with the same counterparties, which reduced our maximum loss due to counterparty credit risk by $
The credit exposure related to commodity derivative instruments is represented by the fair value of contracts with a net positive fair value, representing expected future receipts, at the reporting date. At such times, these outstanding instruments expose us to losses in the event of nonperformance by the counterparties to the agreements. Should the creditworthiness of one or more of the counterparties decline, the ability to mitigate nonperformance risk is limited to a counterparty agreeing to either a voluntary termination and subsequent cash settlement or a novation of the derivative contract to a third party. In the event of a counterparty default, we may sustain a loss and our cash receipts could be negatively impacted.
F-40
Customer Credit Risk
We extend credit to customers and other parties in the normal course of business. We have established various procedures to manage our credit exposure, including initial credit approvals, credit limits and terms, letters of credit, and rights of offset. We also use prepayments and guarantees to limit credit risk to ensure that our established credit criteria are met. Our allowance for doubtful accounts was $
Significant Commercial Relationship
During the years ended December 31, 2020, 2019 and 2018, sales of commodities and fees from midstream services provided to Petredec (Europe) Limited comprised approximately
Interest Rate Risk
We are exposed to changes in interest rates, primarily as a result of variable rate borrowings under the TRP Revolver and the Securitization Facility.
Casualty or Other Risks
Targa maintains coverage in various insurance programs on our behalf, which provides us with property damage, business interruption and other coverages which are customary for the nature and scope of our operations. The majority of the insurance costs described above is allocated to us by Targa through the Partnership Agreement described in Note 14 – Related Party Transactions.
Management believes that Targa has adequate insurance coverage, although insurance may not cover every type of interruption that might occur. As a result of insurance market conditions, premiums and deductibles may change overtime, and in some instances, certain insurance may become unavailable, or available for only reduced amounts of coverage. As a result, Targa may not be able to renew existing insurance policies or procure other desirable insurance on commercially reasonable terms, if at all.
If we were to incur a significant liability for which we were not fully insured, it could have a material impact on our consolidated financial position and results of operations. In addition, the proceeds of any such insurance may not be paid in a timely manner and may be insufficient if such an event were to occur. Any event that interrupts the revenues generated by us, or which causes us to make significant expenditures not covered by insurance, could reduce our ability to meet our financial obligations. Furthermore, even when a business interruption event is covered, it could affect interperiod results as we would not recognize the contingent gain until realized in a period following the incident.
Note 18 – Revenue
Fixed consideration allocated to remaining performance obligations
The following table presents the estimated minimum revenue related to unsatisfied performance obligations at the end of the reporting period, and is comprised of fixed consideration primarily attributable to contracts with minimum volume commitments, for which a guaranteed amount of revenue can be calculated. These contracts are comprised primarily of gathering and processing, fractionation, export, terminaling and storage agreements with remaining contract terms ranging from
|
|
|
2021 |
|
|
2022 |
|
|
2023 and after |
|
|||
|
Fixed consideration to be recognized as of December 31, 2020 |
|
$ |
|
|
|
$ |
|
|
|
$ |
|
|
Based on the optional exemptions that we elected to apply, the amounts presented in the table above exclude remaining performance obligations for (i) variable consideration for which the allocation exception is met and (ii) contracts with an original expected duration of one year or less.
For additional information on our revenue recognition policy, see Note 3 – Significant Accounting Policies. For disclosures related to disaggregated revenue, see Note 23 – Segment Information.
F-41
Note 19 — Other Operating (Income) Expense
Other Operating (Income) Expense is comprised of the following:
|
|
Year Ended December 31, |
|
|||||||||
|
|
2020 |
|
|
2019 |
|
|
2018 |
|
|||
|
(Gain) loss on sale or disposition of business and assets |
$ |
|
|
|
$ |
|
|
|
$ |
( |
) |
|
Write-down of assets (1) |
|
|
|
|
|
|
|
|
|
— |
|
|
Other |
|
|
|
|
|
|
|
|
|
|
|
|
|
$ |
|
|
|
$ |
|
|
|
$ |
|
|
|
(1) |
|
The (Gain) loss on sale or disposition of business and assets is comprised of the following:
|
|
Year Ended December 31, |
|
|||||||||
|
|
2020 |
|
|
2019 |
|
|
2018 |
|
|||
|
Channelview asset sale |
$ |
|
|
|
$ |
— |
|
|
$ |
— |
|
|
Delaware crude system |
|
— |
|
|
|
|
|
|
|
— |
|
|
Sale of inland marine barge business |
|
— |
|
|
|
— |
|
|
|
( |
) |
|
Exchange of a portion of Versado gathering system |
|
— |
|
|
|
— |
|
|
|
( |
) |
|
Sale of storage and terminaling facilities |
|
— |
|
|
|
— |
|
|
|
|
|
|
Disposal of benzene treating unit |
|
— |
|
|
|
— |
|
|
|
|
|
|
Other |
|
|
|
|
|
|
|
|
|
|
|
|
|
$ |
|
|
|
$ |
|
|
|
$ |
( |
) |
Note 20 – Income Tax
Our income tax expense (benefit) is summarized below:
|
|
2020 |
|
|
2019 |
|
|
2018 |
|
|||
|
Deferred expense (benefit) |
$ |
( |
) |
|
$ |
( |
) |
|
$ |
( |
) |
TPL Arkoma Inc., a corporate subsidiary of ours, is subject to federal and state income tax. Our corporate subsidiary accounts for income taxes under the asset and liability method and provides deferred income taxes for all significant temporary differences.
On December 22, 2017, the U.S. government enacted comprehensive tax legislation commonly referred to as the Tax Cuts and Jobs Act (the “Tax Act”), which significantly changed United States corporate income tax laws beginning, generally, in 2018. These changes included, among others, (1) a permanent reduction of the United States corporate income tax rate from a top marginal rate of
The SEC staff issued Staff Accounting Bulletin No. 118 ("SAB 118"), which provides guidance on accounting for the tax effects of the Tax Act. SAB 118 provides a measurement period that should not extend beyond
F-42
Our accounting for all applicable elements of the Tax Act is complete:
|
|
• |
We reclassified $ |
|
|
• |
The Tax Act reduces the corporate tax rate to 21%, effective January 1, 2018. We recorded a provisional deferred tax benefit of $ |
|
|
• |
In the year ended December 31, 2017, we recorded a provisional tax depreciation expense of $ |
On March 27, 2020, the Coronavirus Aid, Relief, and Economic Security (“CARES”) Act was enacted into law.
Prior to the TRC/TRP Merger, we were subject to the Texas margin tax, consisting generally of a
Our deferred income tax assets and liabilities at December 31, 2020 and 2019, consisted of differences related to the timing of recognition of certain types of costs as follows:
|
|
2020 |
|
|
2019 |
|
||
|
Deferred tax assets: |
|
|
|
|
|
|
|
|
Net operating loss carryforwards |
$ |
|
|
|
$ |
|
|
|
Valuation allowance |
|
( |
) |
|
|
|
|
|
Deferred tax assets after valuation allowance: |
$ |
|
|
|
$ |
|
|
|
Deferred tax liabilities: |
|
|
|
|
|
|
|
|
Property, plant, and equipment |
|
( |
) |
|
|
( |
) |
|
Net deferred tax asset (liability) |
$ |
( |
) |
|
$ |
( |
) |
As of December 31, 2020, TPL Arkoma Inc. had net operating loss carryforwards of $
F-43
Note 21 — Supplemental Cash Flow Information
|
|
Year Ended December 31, |
|
|||||||||
|
|
2020 |
|
|
2019 |
|
|
2018 |
|
|||
|
Cash: |
|
|
|
|
|
|
|
|
|
|
|
|
Interest paid, net of capitalized interest (1) |
$ |
|
|
|
$ |
|
|
|
$ |
|
|
|
Income taxes paid, net of refunds |
|
|
|
|
|
( |
) |
|
|
|
|
|
Non-cash investing activities: |
|
|
|
|
|
|
|
|
|
|
|
|
Deadstock commodity inventory transferred to property, plant and equipment |
$ |
|
|
|
$ |
|
|
|
$ |
|
|
|
Impact of capital expenditure accruals on property, plant and equipment, net |
|
( |
) |
|
|
( |
) |
|
|
|
|
|
Transfers from materials and supplies inventory to property, plant and equipment |
|
|
|
|
|
|
|
|
|
|
|
|
Contribution of property, plant and equipment to investments in unconsolidated affiliates |
|
— |
|
|
|
— |
|
|
|
|
|
|
Change in ARO liability and property, plant and equipment due to revised cash flow estimate and additions |
|
( |
) |
|
|
|
|
|
|
|
|
|
Property, plant and equipment received in asset exchange |
|
— |
|
|
|
— |
|
|
|
|
|
|
Receivable for asset exchange |
|
— |
|
|
|
— |
|
|
|
|
|
|
Asset received related to conveyance of ownership interest in investment in unconsolidated affiliate |
|
— |
|
|
|
— |
|
|
|
|
|
|
Non-cash financing activities: |
|
|
|
|
|
|
|
|
|
|
|
|
Changes in accrued distributions to noncontrolling interests |
$ |
( |
) |
|
$ |
|
|
|
$ |
— |
|
|
Non-cash balance sheet movements related to assets held for sale (See Note 4 - Joint Ventures, Acquisitions and Divestitures): |
|
|
|
|
|
|
|
|
|
|
|
|
Trade receivables |
$ |
— |
|
|
$ |
|
|
|
$ |
— |
|
|
Intangible assets, net accumulated amortization and estimated loss on sale |
|
— |
|
|
|
|
|
|
|
— |
|
|
Goodwill |
|
— |
|
|
|
|
|
|
|
— |
|
|
Property, plant and equipment, net of accumulated depreciation and estimated loss on sale |
|
— |
|
|
|
|
|
|
|
— |
|
|
Accounts payable and accrued liabilities |
|
— |
|
|
|
|
|
|
|
— |
|
|
Other long-term obligations |
|
— |
|
|
|
|
|
|
|
— |
|
|
Lease liabilities arising from recognition of right-of-use assets: |
|
|
|
|
|
|
|
|
|
|
|
|
Operating lease |
$ |
|
|
|
$ |
|
|
|
$ |
— |
|
|
Finance lease |
|
|
|
|
|
|
|
|
|
— |
|
|
(1) |
|
Note 22 — Compensation Plans
2010 TRC Stock Incentive Plan
In December 2010, TRC adopted the Targa Resources Corp. 2010 Stock Incentive Plan for employees, consultants and non-employee directors of the Company. In May 2017, the 2010 TRC Plan was amended and restated (the “2010 TRC Plan”). Total authorized shares of common stock under the plan is
Unless otherwise specified, the compensation costs for the awards listed below were recognized as expenses over related vesting periods based on the grant-date fair values, reduced by forfeitures incurred.
Restricted Stock Awards - Restricted stock entitles the recipient to cash dividends. Dividends on unvested restricted stock will be accrued when declared and recorded as short-term or long-term liabilities, dependent on the time remaining until payment of the dividends, and paid in cash when the award vests. The restricted stock awards will be included in the outstanding shares of the common stock upon issuance.
Director Grants – The committee awarded TRC common stock to our outside directors. In 2020, 2019 and 2018, TRC issued
F-44
Restricted Stock Units Awards – Restricted Stock Units (“RSUs”) are similar to restricted stock, except that shares of common stock are not issued until the RSUs vest. The vesting periods generally vary from
Restricted Stock Units in Lieu of Bonus – In 2020, 2019 and 2018, TRC granted
The following table summarizes the restricted stock and RSUs under the 2010 TRC Plan in shares and in dollars for the year indicated.
|
|
|
Number of shares |
|
|
Weighted Average Grant-Date Fair Value |
|
||
|
Outstanding at December 31, 2019 |
|
|
|
|
|
$ |
|
|
|
Granted |
|
|
|
|
|
|
|
|
|
Forfeited |
|
|
( |
) |
|
|
|
|
|
Vested |
|
|
( |
) |
|
|
|
|
|
Outstanding at December 31, 2020 |
|
|
|
|
|
|
|
|
Performance Share Units
During 2020, 2019 and 2018, TRC granted
The vesting of the PSUs is dependent on the satisfaction of a combination of certain service-related conditions and the Company’s total shareholder return (“TSR”) relative to the TSR of the members of a specified comparator group of publicly-traded midstream companies (the “LTIP Peer Group”) measured over designated periods. For the PSUs granted in 2018 and 2019, the TSR performance factor is determined by the Committee at the end of the overall performance period based on relative performance over the designated weighting periods as follows: (i)
Compensation cost for equity-settled PSUs was recognized as an expense over the performance period based on fair value at the grant date. The compensation cost will be reduced if forfeitures occur. Fair value was calculated using a simulated share price that incorporates peer ranking. DERs associated with equity-settled PSUs were accrued over the performance period as a reduction of owners’ equity. TRC evaluated the grant date fair value using a Monte Carlo simulation model and historical volatility assumption with an expected term of
F-45
The following table summarizes the PSUs under the 2010 TRC Plan in shares and in dollars for the years indicated.
|
|
|
Number of shares |
|
|
Weighted Average Grant-Date Fair Value |
|
||
|
Outstanding at December 31, 2019 |
|
|
|
|
|
$ |
|
|
|
Granted |
|
|
|
|
|
|
|
|
|
Vested |
|
|
( |
) |
|
|
|
|
|
Outstanding at December 31, 2020 |
|
|
|
|
|
|
|
|
Cash-settled Awards
During 2019 and 2018, TRC issued
TRC Equity Compensation Plan
In connection with the TRC/TRP Merger, TRC adopted and assumed our Long-term Incentive Plan and outstanding awards thereunder, and amended and restated the plan and renamed it the Targa Resources Corp. Equity Compensation Plan (the “Plan”). TRC no longer makes grants under the Plan, which terminated in February 2017, because the number of shares reserved under the Equity Compensation Plan have been substantially exhausted. As of the year ended December 31, 2020, no RSUs remain outstanding under this Plan
TRC Long Term Incentive Plan
The TRC LTIP is administered by the Compensation Committee of the Targa board of directors (the “Compensation Committee”). Prior to the TRC/TRP Merger, the TRC LTIP provided for the grant of cash-settled performance units only. In connection with the TRC/TRP Merger, performance unit grant agreements were amended to convert TRP’s outstanding cash-settled performance unit obligation to cash-settled restricted stock units.
During 2018, the remaining
Stock compensation expense under the plans totaled $
The fair values of share-based awards vested in 2020, 2019 and 2018 were $
Subsequent Events
In January 2021, the Compensation Committee made the following awards under the 2010 TRC Plan.
|
|
• |
|
|
|
• |
|
|
|
• |
288,983 shares of PSUs to executive management for the 2021 compensation cycle that will vest in |
In January 2021,
In January 2021,
In January 2021,
F-46
Note 23 — Segment Information
We operate in
In the fourth quarter of 2019, we made the following changes to the presentation of our reportable segments:
|
|
• |
Renamed the Logistics and Marketing segment as Logistics and Transportation. The updated name better describes the business composition and activity of the segment given the recent completion of Grand Prix. The change in naming convention did not impact previously reported results for the segment. This segment is also referred to as the Downstream Business. |
|
|
• |
Due to changes in how our executive team evaluates segment performance, results of commodity derivative activities related to our equity volume hedges that are designated as accounting hedges are now reported in the Gathering and Processing segment. These hedge activities were previously reported in Other. Our prior period segment information has been updated to reflect the change. There was no impact to our Consolidated Statements of Operations. |
Our Gathering and Processing segment includes assets used in the gathering and/or purchase and sale of natural gas produced from oil and gas wells, removing impurities and processing this raw natural gas into merchantable natural gas by extracting NGLs; and assets used for the gathering and terminaling and/or purchase and sale of crude oil. The Gathering and Processing segment's assets are located in the Permian Basin of West Texas and Southeast New Mexico (including the Midland, Central and Delaware Basins); the Eagle Ford Shale in South Texas; the Barnett Shale in North Texas; the Anadarko, Ardmore, and Arkoma Basins in Oklahoma (including the SCOOP and STACK) and South Central Kansas; the Williston Basin in North Dakota (including the Bakken and Three Forks plays); and the onshore and near offshore regions of the Louisiana Gulf Coast and the Gulf of Mexico.
Our Logistics and Transportation segment includes the activities and assets necessary to convert mixed NGLs into NGL products and also includes other assets and value-added services such as transporting, storing, fractionating, terminaling, and marketing of NGLs and NGL products, including services to LPG exporters and certain natural gas supply and marketing activities in support of our other businesses. The Logistics and Transportation segment also includes Grand Prix, which connects our gathering and processing positions in the Permian Basin, Southern Oklahoma and North Texas with our downstream facilities in Mont Belvieu, Texas, as well as our equity interest in GCX, a natural gas pipeline connecting the Waha hub in West Texas and other receipt points, including many of our Midland Basin processing facilities, to Agua Dulce in South Texas and other delivery points. The associated assets, including these pipelines, are generally connected to and supplied in part by our Gathering and Processing segment and, except for the pipelines and smaller terminals, are located predominantly in Mont Belvieu and Galena Park, Texas, and in Lake Charles, Louisiana.
Other contains the mark-to-market gains/losses related to derivative contracts that were not designated as cash flow hedges. Elimination of inter-segment transactions are reflected in the corporate and eliminations column.
Reportable segment information is shown in the following tables:
|
|
|
Year Ended December 31, 2020 |
|
|||||||||||||||||
|
|
|
Gathering and Processing |
|
|
Logistics and Transportation |
|
|
Other |
|
|
Corporate and Eliminations |
|
|
Total |
|
|||||
|
Revenues |
|
|
|
|
|
|
|
|
|
|
|
|
|
|
|
|
|
|
|
|
|
Sales of commodities |
|
$ |
|
|
|
$ |
|
|
|
$ |
|
|
|
$ |
— |
|
|
$ |
|
|
|
Fees from midstream services |
|
|
|
|
|
|
|
|
|
|
— |
|
|
|
— |
|
|
|
|
|
|
|
|
|
|
|
|
|
|
|
|
|
|
|
|
|
— |
|
|
|
|
|
|
Intersegment revenues |
|
|
|
|
|
|
|
|
|
|
|
|
|
|
|
|
|
|
|
|
|
Sales of commodities |
|
|
|
|
|
|
|
|
|
|
— |
|
|
|
( |
) |
|
|
— |
|
|
Fees from midstream services |
|
|
|
|
|
|
|
|
|
|
— |
|
|
|
( |
) |
|
|
— |
|
|
|
|
|
|
|
|
|
|
|
|
|
— |
|
|
|
( |
) |
|
|
— |
|
|
Revenues |
|
$ |
|
|
|
$ |
|
|
|
$ |
|
|
|
$ |
( |
) |
|
$ |
|
|
|
Operating margin |
|
$ |
|
|
|
$ |
|
|
|
$ |
|
|
|
$ |
— |
|
|
$ |
|
|
|
Other financial information: |
|
|
|
|
|
|
|
|
|
|
|
|
|
|
|
|
|
|
|
|
|
Total assets (1) |
|
$ |
|
|
|
$ |
|
|
|
$ |
|
|
|
$ |
|
|
|
$ |
|
|
|
Goodwill |
|
$ |
|
|
|
$ |
— |
|
|
$ |
— |
|
|
$ |
— |
|
|
$ |
|
|
|
Capital expenditures |
|
$ |
|
|
|
$ |
|
|
|
$ |
— |
|
|
$ |
|
|
|
$ |
|
|
|
(1) |
|
F-47
|
|
|
Year Ended December 31, 2019 |
|
|||||||||||||||||
|
|
|
Gathering and Processing |
|
|
Logistics and Transportation |
|
|
Other |
|
|
Corporate and Eliminations |
|
|
Total |
|
|||||
|
Revenues |
|
|
|
|
|
|
|
|
|
|
|
|
|
|
|
|
|
|
|
|
|
Sales of commodities |
|
$ |
|
|
|
$ |
|
|
|
$ |
( |
) |
|
$ |
— |
|
|
$ |
|
|
|
Fees from midstream services |
|
|
|
|
|
|
|
|
|
|
— |
|
|
|
— |
|
|
|
|
|
|
|
|
|
|
|
|
|
|
|
|
|
( |
) |
|
|
— |
|
|
|
|
|
|
Intersegment revenues |
|
|
|
|
|
|
|
|
|
|
|
|
|
|
|
|
|
|
|
|
|
Sales of commodities |
|
|
|
|
|
|
|
|
|
|
— |
|
|
|
( |
) |
|
|
— |
|
|
Fees from midstream services |
|
|
|
|
|
|
|
|
|
|
— |
|
|
|
( |
) |
|
|
— |
|
|
|
|
|
|
|
|
|
|
|
|
|
— |
|
|
|
( |
) |
|
|
— |
|
|
Revenues |
|
$ |
|
|
|
$ |
|
|
|
$ |
( |
) |
|
$ |
( |
) |
|
$ |
|
|
|
Operating margin |
|
$ |
|
|
|
$ |
|
|
|
$ |
( |
) |
|
$ |
— |
|
|
$ |
|
|
|
Other financial information: |
|
|
|
|
|
|
|
|
|
|
|
|
|
|
|
|
|
|
|
|
|
Total assets (1) |
|
$ |
|
|
|
$ |
|
|
|
$ |
|
|
|
$ |
|
|
|
$ |
|
|
|
Goodwill |
|
$ |
|
|
|
$ |
— |
|
|
$ |
— |
|
|
$ |
— |
|
|
$ |
|
|
|
Capital expenditures |
|
$ |
|
|
|
$ |
|
|
|
$ |
— |
|
|
$ |
|
|
|
$ |
|
|
|
(1) |
Assets in the Corporate and Eliminations column primarily include cash, prepaids and debt issuance costs for our TRP Revolver. |
|
|
|
Year Ended December 31, 2018 |
|
|||||||||||||||||
|
|
|
Gathering and Processing |
|
|
Logistics and Transportation |
|
|
Other |
|
|
Corporate and Eliminations |
|
|
Total |
|
|||||
|
Revenues |
|
|
|
|
|
|
|
|
|
|
|
|
|
|
|
|
|
|
|
|
|
Sales of commodities |
|
$ |
|
|
|
$ |
|
|
|
$ |
( |
) |
|
$ |
— |
|
|
$ |
|
|
|
Fees from midstream services |
|
|
|
|
|
|
|
|
|
|
— |
|
|
|
— |
|
|
|
|
|
|
|
|
|
|
|
|
|
|
|
|
|
( |
) |
|
|
— |
|
|
|
|
|
|
Intersegment revenues |
|
|
|
|
|
|
|
|
|
|
|
|
|
|
|
|
|
|
|
|
|
Sales of commodities |
|
|
|
|
|
|
|
|
|
|
— |
|
|
|
( |
) |
|
|
— |
|
|
Fees from midstream services |
|
|
|
|
|
|
|
|
|
|
— |
|
|
|
( |
) |
|
|
— |
|
|
|
|
|
|
|
|
|
|
|
|
|
— |
|
|
|
( |
) |
|
|
— |
|
|
Revenues |
|
$ |
|
|
|
$ |
|
|
|
$ |
( |
) |
|
$ |
( |
) |
|
$ |
|
|
|
Operating margin |
|
$ |
|
|
|
$ |
|
|
|
$ |
( |
) |
|
$ |
— |
|
|
$ |
|
|
|
Other financial information: |
|
|
|
|
|
|
|
|
|
|
|
|
|
|
|
|
|
|
|
|
|
Total assets (1) |
|
$ |
|
|
|
$ |
|
|
|
$ |
|
|
|
$ |
|
|
|
$ |
|
|
|
Goodwill |
|
$ |
|
|
|
$ |
— |
|
|
$ |
— |
|
|
$ |
— |
|
|
$ |
|
|
|
Capital expenditures |
|
$ |
|
|
|
$ |
|
|
|
$ |
— |
|
|
$ |
|
|
|
$ |
|
|
|
(1) |
Assets in the Corporate and Eliminations column primarily include cash, prepaids and debt issuance costs for our TRP Revolver. |
F-48
The following table shows our consolidated revenues disaggregated by product and service for the periods presented:
|
|
|
2020 |
|
|
2019 |
|
|
2018 |
|
|||
|
Sales of commodities: |
|
|
|
|
|
|
|
|
|
|
|
|
|
Revenue recognized from contracts with customers: |
|
|
|
|
|
|
|
|
|
|
|
|
|
Natural gas |
|
$ |
|
|
|
$ |
|
|
|
$ |
|
|
|
NGL |
|
|
|
|
|
|
|
|
|
|
|
|
|
Condensate and crude oil |
|
|
|
|
|
|
|
|
|
|
|
|
|
Petroleum products |
|
|
|
|
|
|
|
|
|
|
|
|
|
|
|
|
|
|
|
|
|
|
|
|
|
|
|
Non-customer revenue: |
|
|
|
|
|
|
|
|
|
|
|
|
|
Derivative activities - Hedge |
|
|
|
|
|
|
|
|
|
|
( |
) |
|
Derivative activities - Non-hedge (1) |
|
|
|
|
|
|
( |
) |
|
|
( |
) |
|
|
|
|
|
|
|
|
( |
) |
|
|
( |
) |
|
Total sales of commodities |
|
|
|
|
|
|
|
|
|
|
|
|
|
|
|
|
|
|
|
|
|
|
|
|
|
|
|
Fees from midstream services: |
|
|
|
|
|
|
|
|
|
|
|
|
|
Revenue recognized from contracts with customers: |
|
|
|
|
|
|
|
|
|
|
|
|
|
Gathering and processing |
|
|
|
|
|
|
|
|
|
|
|
|
|
NGL transportation, fractionation and services |
|
|
|
|
|
|
|
|
|
|
|
|
|
Storage, terminaling and export |
|
|
|
|
|
|
|
|
|
|
|
|
|
Other |
|
|
|
|
|
|
|
|
|
|
|
|
|
Total fees from midstream services |
|
|
|
|
|
|
|
|
|
|
|
|
|
|
|
|
|
|
|
|
|
|
|
|
|
|
|
Total revenues |
|
$ |
|
|
|
$ |
|
|
|
$ |
|
|
|
(1) |
|
|
The following table shows a reconciliation of reportable segment operating margin to income (loss) before income taxes for the periods presented:
|
|
|
2020 |
|
|
2019 |
|
|
2018 |
|
|||
|
Reconciliation of reportable segment operating margin to income (loss) before income taxes: |
|
|
|
|
|
|
|
|
|
|
|
|
|
Gathering and Processing operating margin |
|
$ |
|
|
|
$ |
|
|
|
$ |
|
|
|
Logistics and Transportation operating margin |
|
|
|
|
|
|
|
|
|
|
|
|
|
Other operating margin |
|
|
|
|
|
|
( |
) |
|
|
( |
) |
|
Depreciation and amortization expense |
|
|
( |
) |
|
|
( |
) |
|
|
( |
) |
|
General and administrative expense |
|
|
( |
) |
|
|
( |
) |
|
|
( |
) |
|
Impairment of long-lived assets |
|
|
( |
) |
|
|
( |
) |
|
|
— |
|
|
Impairment of goodwill |
|
|
— |
|
|
|
— |
|
|
|
( |
) |
|
Interest expense, net |
|
|
( |
) |
|
|
( |
) |
|
|
( |
) |
|
Equity earnings (loss) |
|
|
|
|
|
|
|
|
|
|
|
|
|
Gain (loss) on sale or disposition of business and assets |
|
|
( |
) |
|
|
( |
) |
|
|
|
|
|
Write-down of assets |
|
|
( |
) |
|
|
( |
) |
|
|
— |
|
|
Gain (loss) from financing activities |
|
|
|
|
|
|
( |
) |
|
|
( |
) |
|
Gain (loss) from sale of equity-method investment |
|
|
— |
|
|
|
|
|
|
|
— |
|
|
Change in contingent considerations |
|
|
|
|
|
|
( |
) |
|
|
|
|
|
Other, net |
|
|
|
|
|
|
( |
) |
|
|
( |
) |
|
Income (loss) before income taxes |
|
$ |
( |
) |
|
$ |
( |
) |
|
$ |
|
|
F-49
Exhibit 21.1
Targa Resources Partners LP Subsidiary List
|
Entity Name |
Jurisdiction of Formation |
|
Allied CNG Ventures LLC |
Delaware |
|
Carnero G&P LLC |
Delaware |
|
Cayenne Pipeline, LLC |
Delaware |
|
Cedar Bayou Fractionators, L.P. |
Delaware |
|
Centrahoma Processing LLC |
Delaware |
|
DEVCO Holdings LLC |
Delaware |
|
Downstream Energy Ventures Co., L.L.C. |
Delaware |
|
FCPP Pipeline, LLC |
Delaware |
|
Flag City Processing Partners, LLC |
Delaware |
|
Floridian Natural Gas Storage Company, LLC |
Delaware |
|
Grand Prix Development LLC |
Delaware |
|
Grand Prix Pipeline LLC |
Delaware |
|
Gulf Coast Express Pipeline LLC |
Delaware |
|
Gulf Coast Fractionators |
Texas |
|
Little Missouri 4 LLC |
Delaware |
|
Pecos Pipeline LLC |
Delaware |
|
Sajet Development LLC |
Delaware |
|
Sajet Properties LLC |
Delaware |
|
Sajet Resources LLC |
Delaware |
|
Salta Properties LLC |
Delaware |
|
Setting Sun Pipeline Corporation |
Delaware |
|
Slider WestOk Gathering, LLC |
Delaware |
|
T2 Eagle Ford Gathering Company LLC |
Delaware |
|
T2 Gas Utility LLC |
Texas |
|
T2 LaSalle Gas Utility LLC |
Texas |
|
T2 LaSalle Gathering Company LLC |
Delaware |
|
Targa Acquisition LLC |
Delaware |
|
Targa Badlands Holdings LLC |
Delaware |
|
Targa Badlands LLC |
Delaware |
|
Targa Canada Liquids Inc. |
British Columbia |
|
Targa Capital LLC |
Delaware |
|
Targa Chaney Dell LLC |
Delaware |
|
Targa Cogen LLC |
Delaware |
|
Targa Delaware LLC |
Delaware |
|
Targa Downstream LLC |
Delaware |
|
Targa Gas Marketing LLC |
Delaware |
|
Targa Gas Pipeline LLC |
Delaware |
|
Targa Gas Processing LLC |
Delaware |
|
Targa GCX Pipeline LLC |
Delaware |
|
Targa Gulf Coast NGL Pipeline LLC |
Delaware |
|
Targa Holding LLC |
Delaware |
|
Targa Intrastate Pipeline LLC |
Delaware |
|
Targa Liquids Marketing and Trade LLC |
Delaware |
|
Targa Louisiana Intrastate LLC |
Delaware |
|
Targa Midkiff LLC |
Delaware |
|
Targa Midland Gas Pipeline LLC |
Delaware |
|
Targa Midland LLC |
Delaware |
|
Targa Midstream Services LLC |
Delaware |
Exhibit 21.1
|
Entity Name |
Jurisdiction of Formation |
|
Targa MLP Capital LLC |
Delaware |
|
Targa NGL Pipeline Company LLC |
Delaware |
|
Targa Pipeline Escrow LLC |
Delaware |
|
Targa Pipeline Finance Corporation |
Delaware |
|
Targa Pipeline Mid-Continent Holdings LLC |
Delaware |
|
Targa Pipeline Mid-Continent LLC |
Delaware |
|
Targa Pipeline Mid-Continent WestOk LLC |
Delaware |
|
Targa Pipeline Mid-Continent WestTex LLC |
Delaware |
|
Targa Pipeline Operating Partnership LP |
Delaware |
|
Targa Pipeline Partners GP LLC |
Delaware |
|
Targa Pipeline Partners LP |
Delaware |
|
Targa Receivables LLC |
Delaware |
|
Targa Resources Operating GP LLC |
Delaware |
|
Targa Resources Operating LLC |
Delaware |
|
Targa Resources Partners Finance Corporation |
Delaware |
|
Targa Resources Partners LP |
Delaware |
|
Targa Southern Delaware LLC |
Delaware |
|
Targa SouthOk NGL Pipeline LLC |
Oklahoma |
|
Targa SouthTex Midstream Company LP |
Texas |
|
Targa Train 6 LLC |
Delaware |
|
Targa Train 7 LLC |
Delaware |
|
Targa Train 8 LLC |
Delaware |
|
Targa Transport LLC |
Delaware |
|
Terracotta Ventures LLC |
Delaware |
|
Tesla Resources LLC |
Delaware |
|
Tesuque Pipeline, LLC |
Delaware |
|
TPL Arkoma Holdings LLC |
Delaware |
|
TPL Arkoma Inc. |
Delaware |
|
TPL Arkoma Midstream LLC |
Delaware |
|
TPL Barnett LLC |
Delaware |
|
TPL Gas Treating LLC |
Delaware |
|
TPL SouthTex Gas Utility Company LP |
Texas |
|
TPL SouthTex Midstream Holding Company LP |
Texas |
|
TPL SouthTex Midstream LLC |
Delaware |
|
TPL SouthTex Pipeline Company LLC |
Texas |
|
TPL SouthTex Processing Company LP |
Texas |
|
TPL SouthTex Transmission Company LP |
Texas |
|
Velma Gas Processing Company, LLC |
Delaware |
|
Velma Intrastate Gas Transmission Company, LLC |
Delaware |
|
Venice Energy Services Company, L.L.C. |
Delaware |
|
Versado Gas Processors, L.L.C. |
Delaware |
|
WestTex Processing Company LLC |
Delaware |
Exhibit 31.1
CERTIFICATION OF CHIEF EXECUTIVE OFFICER
PURSUANT TO RULE 13A-14(A) AND RULE 15D-14(A)
OF THE SECURITIES EXCHANGE ACT OF 1934, AS AMENDED
I, Matthew J. Meloy, certify that:
1. I have reviewed this Annual Report on Form 10-K of Targa Resources Partners LP (the “registrant”);
2. Based on my knowledge, this report does not contain any untrue statement of a material fact or omit to state a material fact necessary to make the statements made, in light of the circumstances under which such statements were made, not misleading with respect to the period covered by this report;
3. Based on my knowledge, the financial statements, and other financial information included in this report, fairly present in all material respects the financial condition, results of operations and cash flows of the registrant as of, and for, the periods presented in this report;
4. The registrant’s other certifying officer and I are responsible for establishing and maintaining disclosure controls and procedures (as defined in Exchange Act Rules 13a-15(e) and 15d-15(e)) and internal control over financial reporting (as defined in Exchange Act Rules 13a-15(f) and 15d-15(f)) for the registrant and have:
(a) Designed such disclosure controls and procedures, or caused such disclosure controls and procedures to be designed under our supervision, to ensure that material information relating to the registrant, including its consolidated subsidiaries, is made known to us by others within those entities, particularly during the period in which this report is being prepared;
(b) Designed such internal control over financial reporting, or caused such internal control over financial reporting to be designed under our supervision, to provide reasonable assurance regarding the reliability of financial reporting and the preparation of financial statements for external purposes in accordance with generally accepted accounting principles;
(c) Evaluated the effectiveness of the registrant’s disclosure controls and procedures and presented in this report our conclusions about the effectiveness of the disclosure controls and procedures, as of the end of the period covered by this report based on such evaluation; and
(d) Disclosed in this report any change in the registrant’s internal control over financial reporting that occurred during the registrant’s most recent fiscal quarter (the registrant’s fourth fiscal quarter in the case of an annual report) that has materially affected, or is reasonably likely to materially affect, the registrant’s internal control over financial reporting; and
5. The registrant’s other certifying officer and I have disclosed, based on our most recent evaluation of internal control over financial reporting, to the registrant’s auditors and the audit committee of the registrant’s board of directors (or persons performing the equivalent functions):
(a) All significant deficiencies and material weaknesses in the design or operation of internal control over financial reporting which are reasonably likely to adversely affect the registrant’s ability to record, process, summarize and report financial information; and
(b) Any fraud, whether or not material, that involves management or other employees who have a significant role in the registrant’s internal control over financial reporting.
Date: February 18, 2021
|
By: |
/s/ Matthew J. Meloy |
|
Name: |
Matthew J. Meloy |
|
Title: |
Chief Executive Officer of Targa Resources GP LLC, the general partner of Targa Resources Partners LP |
|
|
(Principal Executive Officer) |
Exhibit 31.2
CERTIFICATION OF CHIEF FINANCIAL OFFICER
PURSUANT TO RULE 13A-14(A) AND RULE 15D-14(A)
OF THE SECURITIES EXCHANGE ACT OF 1934, AS AMENDED
I, Jennifer R. Kneale, certify that:
1. I have reviewed this Annual Report on Form 10-K of Targa Resources Partners LP (the “registrant”);
2. Based on my knowledge, this report does not contain any untrue statement of a material fact or omit to state a material fact necessary to make the statements made, in light of the circumstances under which such statements were made, not misleading with respect to the period covered by this report;
3. Based on my knowledge, the financial statements, and other financial information included in this report, fairly present in all material respects the financial condition, results of operations and cash flows of the registrant as of, and for, the periods presented in this report;
4. The registrant’s other certifying officer and I are responsible for establishing and maintaining disclosure controls and procedures (as defined in Exchange Act Rules 13a-15(e) and 15d-15(e)) and internal control over financial reporting (as defined in Exchange Act Rules 13a-15(f) and 15d-15(f)) for the registrant and have:
(a) Designed such disclosure controls and procedures, or caused such disclosure controls and procedures to be designed under our supervision, to ensure that material information relating to the registrant, including its consolidated subsidiaries, is made known to us by others within those entities, particularly during the period in which this report is being prepared;
(b) Designed such internal control over financial reporting, or caused such internal control over financial reporting to be designed under our supervision, to provide reasonable assurance regarding the reliability of financial reporting and the preparation of financial statements for external purposes in accordance with generally accepted accounting principles;
(c) Evaluated the effectiveness of the registrant’s disclosure controls and procedures and presented in this report our conclusions about the effectiveness of the disclosure controls and procedures, as of the end of the period covered by this report based on such evaluation; and
(d) Disclosed in this report any change in the registrant’s internal control over financial reporting that occurred during the registrant’s most recent fiscal quarter (the registrant’s fourth fiscal quarter in the case of an annual report) that has materially affected, or is reasonably likely to materially affect, the registrant’s internal control over financial reporting; and
5. The registrant’s other certifying officer and I have disclosed, based on our most recent evaluation of internal control over financial reporting, to the registrant’s auditors and the audit committee of the registrant’s board of directors (or persons performing the equivalent functions):
(a) All significant deficiencies and material weaknesses in the design or operation of internal control over financial reporting which are reasonably likely to adversely affect the registrant’s ability to record, process, summarize and report financial information; and
(b) Any fraud, whether or not material, that involves management or other employees who have a significant role in the registrant’s internal control over financial reporting.
Date: February 18, 2021
|
By: |
/s/ Jennifer R. Kneale |
|
Name: |
Jennifer R. Kneale |
|
Title: |
Chief Financial Officer of Targa Resources GP LLC, the general partner of Targa Resources Partners LP |
|
|
(Principal Financial Officer) |
Exhibit 32.1
CERTIFICATION OF CHIEF EXECUTIVE OFFICER PURSUANT TO
18 U.S.C. SECTION 1350,
AS ADOPTED PURSUANT TO
SECTION 906 OF THE SARBANES-OXLEY ACT OF 2002
In connection with the Annual Report on Form 10-K of Targa Resources Partners LP (the “Partnership”) for the year ended December 31, 2020 as filed with the Securities and Exchange Commission on the date hereof (the “Report”), Matthew J. Meloy, as Chief Executive Officer of Targa Resources GP LLC, the general partner of the Partnership, hereby certifies, pursuant to 18 U.S.C. Section 1350, as adopted pursuant to Section 906 of the Sarbanes-Oxley Act of 2002, that, to his knowledge:
(1) The Report fully complies with the requirements of Section 13(a) or 15(d) of the Securities Exchange Act of 1934, as amended; and
(2) The information contained in the Report fairly presents, in all material respects, the financial condition and results of operations of the Partnership.
|
By: |
/s/ Matthew J. Meloy |
|
Name: |
Matthew J. Meloy |
|
Title: |
Chief Executive Officer |
|
of Targa Resources GP LLC, the general partner of Targa Resources Partners LP |
|
Date: February 18, 2021
A signed original of this written statement required by Section 906, or other document authenticating, acknowledging, or otherwise adopting the signature that appears in typed form within the electronic version of this written statement required by Section 906, has been provided to the Partnership and will be retained by the Partnership and furnished to the Securities and Exchange Commission or its staff upon request.
Exhibit 32.2
CERTIFICATION OF CHIEF FINANCIAL OFFICER PURSUANT TO
18 U.S.C. SECTION 1350,
AS ADOPTED PURSUANT TO
SECTION 906 OF THE SARBANES-OXLEY ACT OF 2002
In connection with the Annual Report on Form 10-K of Targa Resources Partners LP (the “Partnership”) for the year ended December 31, 2020 as filed with the Securities and Exchange Commission on the date hereof (the “Report”), Jennifer R. Kneale, as Chief Financial Officer of Targa Resources GP LLC, the general partner of the Partnership, hereby certifies, pursuant to 18 U.S.C. Section 1350, as adopted pursuant to Section 906 of the Sarbanes-Oxley Act of 2002, that, to her knowledge:
(1) The Report fully complies with the requirements of Section 13(a) or 15(d) of the Securities Exchange Act of 1934, as amended; and
(2) The information contained in the Report fairly presents, in all material respects, the financial condition and results of operations of the Partnership.
|
By: |
/s/ Jennifer R. Kneale |
|
Name: |
Jennifer R. Kneale |
|
Title: |
Chief Financial Officer |
|
of Targa Resources GP LLC, the general partner of Targa Resources Partners LP |
|
Date: February 18, 2021
A signed original of this written statement required by Section 906, or other document authenticating, acknowledging, or otherwise adopting the signature that appears in typed form within the electronic version of this written statement required by Section 906, has been provided to the Partnership and will be retained by the Partnership and furnished to the Securities and Exchange Commission or its staff upon request.